HP 2008 Annual Report Download - page 72
Download and view the complete annual report
Please find page 72 of the 2008 HP annual report below. You can navigate through the pages in the report by either clicking on the pages listed below, or by using the keyword search tool below to find specific information within the annual report.-
 1
1 -
2
-
3
-
4
-
5
-
6
-
7
-
8
-
9
-
10
-
11
-
12
-
13
-
14
-
15
-
16
-
17
-
18
-
19
-
20
-
21
-
22
-
23
-
24
-
25
-
26
-
27
-
28
-
29
-
30
-
31
-
32
-
33
-
34
-
35
-
36
-
37
-
38
-
39
-
40
-
41
-
42
-
43
-
44
-
45
-
46
-
47
-
48
-
49
-
50
-
51
-
52
-
53
-
54
-
55
-
56
-
57
-
58
-
59
-
60
-
61
-
 62
62 -
 63
63 -
 64
64 -
 65
65 -
 66
66 -
 67
67 -
 68
68 -
 69
69 -
 70
70 -
 71
71 -
 72
72 -
 73
73 -
 74
74 -
 75
75 -
 76
76 -
 77
77 -
 78
78 -
 79
79 -
 80
80 -
 81
81 -
 82
82 -
83
-
84
-
85
-
86
-
87
-
88
-
89
-
90
-
91
-
92
-
93
-
94
-
95
-
96
-
97
-
98
-
99
-
100
-
101
-
102
-
103
-
104
-
105
-
106
-
107
-
108
-
109
-
110
-
111
-
112
-
113
-
114
-
115
-
116
-
117
-
118
-
119
-
120
-
121
-
122
-
123
-
124
-
125
-
126
-
127
-
128
-
129
-
130
-
131
-
132
-
133
-
134
-
135
-
136
-
137
-
138
-
139
-
140
-
141
-
142
-
143
-
144
-
145
-
146
-
147
-
148
-
149
-
150
-
151
-
152
-
153
-
154
-
155
-
156
-
157
-
158
-
159
-
160
-
161
-
162
-
163
-
164
-
165
-
166
-
167
-
168
-
169
-
170
-
171
-
172
-
173
-
174
-
175
-
176
-
177
-
178
-
179
-
180
-
181
-
182
-
183
 |
 |

HEWLETT-PACKARD COMPANY AND SUBSIDIARIES
Management’s Discussion and Analysis of
Financial Condition and Results of Operations (Continued)
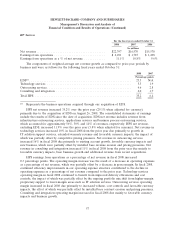
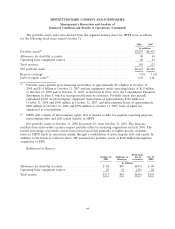
FINANCIAL CONDITION (Sources and Uses of Cash)
Our total cash and cash equivalents declined approximately 10% to $10.2 billion at October 31,
2008 from $11.3 billion at October 31, 2007 due primarily to increased investment spending on
acquisitions and increased borrowings, which were partially offset by positive operating cash flows. Our
cash position remains strong, and we believe our cash balances are sufficient to cover cash outlays
expected in fiscal 2009 associated with additional stock repurchases, acquisitions, company bonus
payments, and other operating cash requirements.
For the fiscal years ended October 31
2008 2007 2006
In millions
Net cash provided by operating activities ................... $14,591 $ 9,615 $11,353
Net cash used in investing activities ....................... (13,711) (9,123) (2,787)
Net cash used in financing activities ....................... (2,020) (5,599) (6,077)
Net (decrease) increase in cash and cash equivalents ........... $ (1,140) $(5,107) $ 2,489
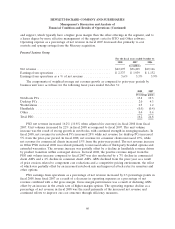
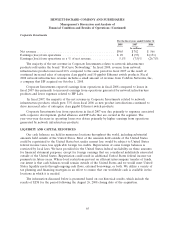
Key Performance Metrics
October 31
2008 2007 2006
Days of sales outstanding in accounts receivable ........................... 45 43 40
Days of supply in inventory .......................................... 27 34 38
Days of purchases outstanding in accounts payable ......................... (49) (50) (59)
Cash conversion cycle .............................................. 23 27 19
Days of sales outstanding in accounts receivable (‘‘DSO’’) measures the average number of days
our receivables are outstanding. DSO is calculated by dividing accounts receivable, net of allowance for
doubtful accounts, by a 90-day average net revenue.
Days of supply in inventory (‘‘DOS’’) measures the average number of days from procurement to
sale of our product. DOS is calculated by dividing inventory by a 90-day average cost of goods sold.
Days of purchases outstanding in accounts payable (‘‘DPO’’) measures the average number of days
our accounts payable balances are outstanding. DPO is calculated by dividing accounts payable by a
90-day average cost of goods sold.
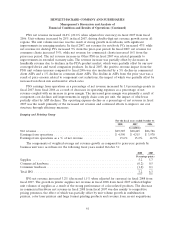
Our working capital requirements depend upon our effective management of the cash conversion
cycle, which represents effectively the number of days that elapse from the day we pay for the purchase
of raw materials to the collection of cash from our customers. The cash conversion cycle is the sum of
DSO and DOS less DPO.
The increase in DSO was due primarily to a higher accounts receivable balance during the fourth
quarter of fiscal 2008 compared to the same period in fiscal 2007 and the effect of the EDS acquisition.
The decrease in DOS was due primarily to more efficient inventory management, higher cost of goods
sold during the fourth quarter of 2008 as a result of increased revenues and the effect of the EDS
acquisition. The slight decrease in DPO was due primarily to purchasing linearity and improved
66