HP 2008 Annual Report Download - page 69
Download and view the complete annual report
Please find page 69 of the 2008 HP annual report below. You can navigate through the pages in the report by either clicking on the pages listed below, or by using the keyword search tool below to find specific information within the annual report.-
 1
1 -
2
-
3
-
4
-
5
-
6
-
7
-
8
-
9
-
10
-
11
-
12
-
13
-
14
-
15
-
16
-
17
-
18
-
19
-
20
-
21
-
22
-
23
-
24
-
25
-
26
-
27
-
28
-
29
-
30
-
31
-
32
-
33
-
34
-
35
-
36
-
37
-
38
-
39
-
40
-
41
-
42
-
43
-
44
-
45
-
46
-
47
-
48
-
49
-
50
-
51
-
52
-
53
-
54
-
55
-
56
-
57
-
58
-
 59
59 -
 60
60 -
 61
61 -
 62
62 -
 63
63 -
 64
64 -
 65
65 -
 66
66 -
 67
67 -
 68
68 -
 69
69 -
 70
70 -
 71
71 -
 72
72 -
 73
73 -
 74
74 -
 75
75 -
 76
76 -
 77
77 -
 78
78 -
 79
79 -
80
-
81
-
82
-
83
-
84
-
85
-
86
-
87
-
88
-
89
-
90
-
91
-
92
-
93
-
94
-
95
-
96
-
97
-
98
-
99
-
100
-
101
-
102
-
103
-
104
-
105
-
106
-
107
-
108
-
109
-
110
-
111
-
112
-
113
-
114
-
115
-
116
-
117
-
118
-
119
-
120
-
121
-
122
-
123
-
124
-
125
-
126
-
127
-
128
-
129
-
130
-
131
-
132
-
133
-
134
-
135
-
136
-
137
-
138
-
139
-
140
-
141
-
142
-
143
-
144
-
145
-
146
-
147
-
148
-
149
-
150
-
151
-
152
-
153
-
154
-
155
-
156
-
157
-
158
-
159
-
160
-
161
-
162
-
163
-
164
-
165
-
166
-
167
-
168
-
169
-
170
-
171
-
172
-
173
-
174
-
175
-
176
-
177
-
178
-
179
-
180
-
181
-
182
-
183
 |
 |

HEWLETT-PACKARD COMPANY AND SUBSIDIARIES
Management’s Discussion and Analysis of
Financial Condition and Results of Operations (Continued)
HPFS earnings from operations as a percentage of net revenue increased by 0.5 percentage points
in fiscal 2008 from fiscal 2007 due primarily to a decrease in operating expenses as a percentage of net
revenue and increased margin on end-of lease activity, the effect of which was offset by higher bad debt
expenses and lower portfolio margins due to higher operating leases in the portfolio asset mix. The
operating expense decrease as a percentage of revenue is driven by a higher rate of increase in
revenues relative to operating expenses due to higher operating lease mix of the portfolio and
continued cost controls.
HPFS net revenue increased by 12.4% in fiscal 2007 from fiscal 2006. The net revenue increase
was due primarily to operating lease growth and higher end-of-lease activity. The financing lease
growth and increased used equipment sales, to a lesser extent, also contributed to the revenue growth.
HPFS earnings from operations as a percentage of net revenue decreased by 0.5 percentage point
in fiscal 2007 from fiscal 2006 due primarily to a decrease in gross margin, which was partially offset by
a decrease in operating expense as a percentage of net revenue. The gross margin decrease was driven
primarily by increased bad debt expenses and lower bad debt recoveries, as well as lower margins on
leases and used equipment sales. The decline in operating expenses as a percentage of net revenue was
due to continued cost controls.
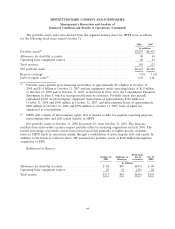
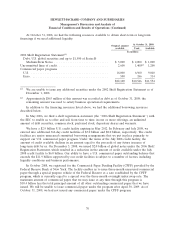
Financing Originations
For the fiscal years ended October 31
2008 2007 2006
In millions
Total financing originations ............................. $4,872 $4,441 $3,994
New financing originations, which represent the amounts of financing provided to customers for
equipment and related software and services, and include intercompany activity, increased 9.7% in
fiscal 2008 from fiscal 2007 and 11.2% in fiscal 2007 from fiscal 2006. The increases reflect higher
financing associated with HP product sales resulting from improved integration and engagement with
HP’s sales efforts and a favorable currency impact.
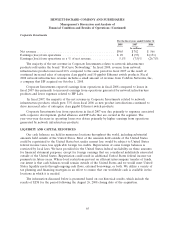
Portfolio Assets and Ratios
HPFS maintains a strategy to generate a competitive return on equity by effectively leveraging its
portfolio against the risks associated with interest rates and credit. The HPFS business model is asset-
intensive and uses certain internal metrics to measure its performance against other financial services
companies, including a segment balance sheet that is derived from our internal management reporting
system. The accounting policies used to derive these amounts is substantially the same as those used by
the consolidated company. However, certain intercompany loans and accounts that are reflected in the
segment balances are eliminated in our Consolidated Financial Statements.
63