HP 2008 Annual Report Download - page 61
Download and view the complete annual report
Please find page 61 of the 2008 HP annual report below. You can navigate through the pages in the report by either clicking on the pages listed below, or by using the keyword search tool below to find specific information within the annual report.-
 1
1 -
2
-
3
-
4
-
5
-
6
-
7
-
8
-
9
-
10
-
11
-
12
-
13
-
14
-
15
-
16
-
17
-
18
-
19
-
20
-
21
-
22
-
23
-
24
-
25
-
26
-
27
-
28
-
29
-
30
-
31
-
32
-
33
-
34
-
35
-
36
-
37
-
38
-
39
-
40
-
41
-
42
-
43
-
44
-
45
-
46
-
47
-
48
-
49
-
50
-
 51
51 -
 52
52 -
 53
53 -
 54
54 -
 55
55 -
 56
56 -
 57
57 -
 58
58 -
 59
59 -
 60
60 -
 61
61 -
 62
62 -
 63
63 -
 64
64 -
 65
65 -
 66
66 -
 67
67 -
 68
68 -
 69
69 -
 70
70 -
 71
71 -
72
-
73
-
74
-
75
-
76
-
77
-
78
-
79
-
80
-
81
-
82
-
83
-
84
-
85
-
86
-
87
-
88
-
89
-
90
-
91
-
92
-
93
-
94
-
95
-
96
-
97
-
98
-
99
-
100
-
101
-
102
-
103
-
104
-
105
-
106
-
107
-
108
-
109
-
110
-
111
-
112
-
113
-
114
-
115
-
116
-
117
-
118
-
119
-
120
-
121
-
122
-
123
-
124
-
125
-
126
-
127
-
128
-
129
-
130
-
131
-
132
-
133
-
134
-
135
-
136
-
137
-
138
-
139
-
140
-
141
-
142
-
143
-
144
-
145
-
146
-
147
-
148
-
149
-
150
-
151
-
152
-
153
-
154
-
155
-
156
-
157
-
158
-
159
-
160
-
161
-
162
-
163
-
164
-
165
-
166
-
167
-
168
-
169
-
170
-
171
-
172
-
173
-
174
-
175
-
176
-
177
-
178
-
179
-
180
-
181
-
182
-
183
 |
 |

HEWLETT-PACKARD COMPANY AND SUBSIDIARIES
Management’s Discussion and Analysis of
Financial Condition and Results of Operations (Continued)
The increase in the overall tax rate in fiscal 2007 from fiscal 2006 was related in part to favorable
income tax adjustments of $599 million recorded in fiscal 2006, which included net favorable tax
adjustments of $565 million to income tax accruals as a result of the settlement of the Internal
Revenue Service (‘‘IRS’’) examinations of our U.S. income tax returns for fiscal years 1993 to 1998.
The reductions to the net income tax accruals for these years related primarily to the resolution of
issues with respect to Puerto Rico manufacturing tax incentives and export tax incentives, and other
issues involving our non-U.S. operations.
For a full reconciliation of our effective tax rate to the U.S. federal statutory rate of 35% and
further explanation of our provision for taxes, see Note 13 to the Consolidated Financial Statements in
Item 8, which is incorporated herein by reference.
Segment Information
A description of the products and services, as well as financial data, for each segment can be
found in Note 18 to the Consolidated Financial Statements in Item 8, which is incorporated herein by
reference. We have realigned segment financial data for the fiscal years ended October 31, 2007 and
2006 to reflect changes in HP’s organizational structure that occurred at the beginning of the first
quarter of fiscal 2008. We describe these changes more fully in Note 18. We have presented the
business segments in this Annual Report on Form 10-K based on the distinct nature of various
businesses such as customer base, homogenity of products and technology. The discussions below
include the results of each of our segments.
Technology Solutions Group
ESS, HPS and HP Software are reported collectively as a broader Technology Solutions Group. We
describe the results of the business segments of TSG in more detail below.
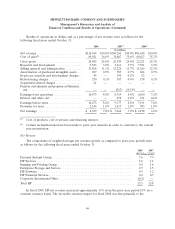
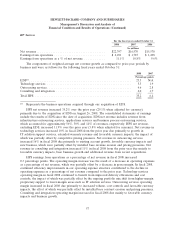
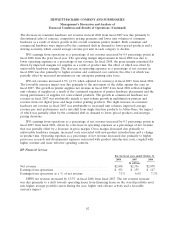
Enterprise Storage and Servers
For the fiscal years ended October 31
2008 2007 2006
In millions
Net revenue ........................................... $19,400 $18,639 $17,211
Earnings from operations ................................. $ 2,577 $ 2,148 $ 1,557
Earnings from operations as a % of net revenue ................ 13.3% 11.5% 9.0%
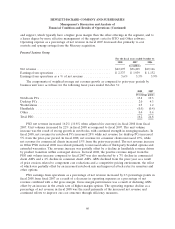
The components of weighted-average net revenue growth as compared to prior-year periods by
business unit were as follows for the following fiscal years ended October 31:
2008 2007
Percentage points
Storage ......................................................... 2.7 0.8
Industry standard servers ............................................ 1.5 8.1
Business critical systems ............................................. (0.1) (0.6)
Total ESS ....................................................... 4.1 8.3
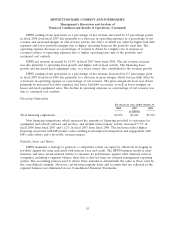
ESS net revenue increased 4.1% (decreased 0.5% when adjusted for currency) in fiscal 2008 from
fiscal 2007. Storage net revenue increased 13% in fiscal 2008 compared to fiscal 2007, with strong
55