HP 2008 Annual Report Download - page 164
Download and view the complete annual report
Please find page 164 of the 2008 HP annual report below. You can navigate through the pages in the report by either clicking on the pages listed below, or by using the keyword search tool below to find specific information within the annual report.-
 1
1 -
2
-
3
-
4
-
5
-
6
-
7
-
8
-
9
-
10
-
11
-
12
-
13
-
14
-
15
-
16
-
17
-
18
-
19
-
20
-
21
-
22
-
23
-
24
-
25
-
26
-
27
-
28
-
29
-
30
-
31
-
32
-
33
-
34
-
35
-
36
-
37
-
38
-
39
-
40
-
41
-
42
-
43
-
44
-
45
-
46
-
47
-
48
-
49
-
50
-
51
-
52
-
53
-
54
-
55
-
56
-
57
-
58
-
59
-
60
-
61
-
62
-
63
-
64
-
65
-
66
-
67
-
68
-
69
-
70
-
71
-
72
-
73
-
74
-
75
-
76
-
77
-
78
-
79
-
80
-
81
-
82
-
83
-
84
-
85
-
86
-
87
-
88
-
89
-
90
-
91
-
92
-
93
-
94
-
95
-
96
-
97
-
98
-
99
-
100
-
101
-
102
-
103
-
104
-
105
-
106
-
107
-
108
-
109
-
110
-
111
-
112
-
113
-
114
-
115
-
116
-
117
-
118
-
119
-
120
-
121
-
122
-
123
-
124
-
125
-
126
-
127
-
128
-
129
-
130
-
131
-
132
-
133
-
134
-
135
-
136
-
137
-
138
-
139
-
140
-
141
-
142
-
143
-
144
-
145
-
146
-
147
-
148
-
149
-
150
-
151
-
152
-
153
-
 154
154 -
 155
155 -
 156
156 -
 157
157 -
 158
158 -
 159
159 -
 160
160 -
 161
161 -
 162
162 -
 163
163 -
 164
164 -
 165
165 -
 166
166 -
 167
167 -
 168
168 -
 169
169 -
 170
170 -
 171
171 -
 172
172 -
 173
173 -
 174
174 -
175
-
176
-
177
-
178
-
179
-
180
-
181
-
182
-
183
 |
 |

HEWLETT-PACKARD COMPANY AND SUBSIDIARIES
Notes to Consolidated Financial Statements (Continued)
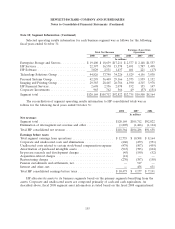
Note 18: Segment Information (Continued)
Net revenue by segment and business unit
The following table provides net revenue by segment and business unit for the following fiscal
years ended October 31:
2008 2007 2006
In millions
Net revenue(1):
Industry standard servers .......................................... $11,657 $ 11,380 $ 9,982
Business critical systems .......................................... 3,538 3,553 3,654
Storage ..................................................... 4,205 3,706 3,575
Enterprise Storage and Servers ....................................... 19,400 18,639 17,211
Technology services ............................................. 9,413 8,539 8,246
Outsourcing services ............................................. 5,597 4,839 4,399
Consulting and integration ......................................... 3,531 3,192 2,933
EDS(2) ..................................................... 3,856 — —
HP Services ................................................... 22,397 16,570 15,578
Business technology optimization(3) ................................... 2,497 2,004 889
Other software(3) ............................................... 532 527 548
HP Software ................................................... 3,029 2,531 1,437
Technology Solutions Group ........................................... 44,826 37,740 34,226
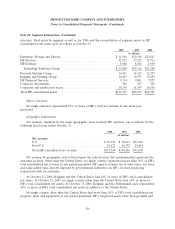
Notebooks ................................................... 22,657 17,650 12,005
Desktops .................................................... 16,626 15,889 14,641
Workstations ................................................. 1,902 1,721 1,368
Handhelds ................................................... 360 531 650
Other ...................................................... 750 618 502
Personal Systems Group ............................................. 42,295 36,409 29,166
Commercial hardware ............................................ 6,799 6,863 6,717
Consumer hardware ............................................. 3,998 4,496 4,485
Supplies .................................................... 18,587 17,106 15,584
Other ...................................................... 1 — —
Imaging and Printing Group ........................................... 29,385 28,465 26,786
HP Financial Services ............................................... 2,698 2,336 2,078
Corporate Investments .............................................. 965 762 566
Total segments ................................................ 120,169 105,712 92,822
Eliminations of inter-segment net revenue and other ........................... (1,805) (1,426) (1,164)
Total HP consolidated net revenue .................................... $118,364 $104,286 $91,658
(1) Certain fiscal 2008 organizational realignments have been reflected retroactively to provide improved visibility and
comparability. The reclassifications resulted in the transfer of revenue among ESS, HPS and HP Software within TSG. In
addition, revenue was transferred among the business units within IPG and among the business units within PSG, but there
was no change to the previously reported revenue for either segment as a whole. There was no impact on the previously
reported revenues of HPFS and Corporate Investments or on the previously reported consolidated financial results for the
company as a whole.
(2) Reflects the revenue of EDS from August 26, 2008 through October 31, 2008.
(3) The OpenView business unit was renamed ‘‘Business Technology Optimization’’ and the OpenCall and other business unit
was renamed ‘‘Other Software’’ effective in fiscal 2008. The renamed ‘‘Other Software’’ business unit includes primarily
OpenCall and information management and business intelligence solutions.
158