HP 2008 Annual Report Download - page 161
Download and view the complete annual report
Please find page 161 of the 2008 HP annual report below. You can navigate through the pages in the report by either clicking on the pages listed below, or by using the keyword search tool below to find specific information within the annual report.-
 1
1 -
2
-
3
-
4
-
5
-
6
-
7
-
8
-
9
-
10
-
11
-
12
-
13
-
14
-
15
-
16
-
17
-
18
-
19
-
20
-
21
-
22
-
23
-
24
-
25
-
26
-
27
-
28
-
29
-
30
-
31
-
32
-
33
-
34
-
35
-
36
-
37
-
38
-
39
-
40
-
41
-
42
-
43
-
44
-
45
-
46
-
47
-
48
-
49
-
50
-
51
-
52
-
53
-
54
-
55
-
56
-
57
-
58
-
59
-
60
-
61
-
62
-
63
-
64
-
65
-
66
-
67
-
68
-
69
-
70
-
71
-
72
-
73
-
74
-
75
-
76
-
77
-
78
-
79
-
80
-
81
-
82
-
83
-
84
-
85
-
86
-
87
-
88
-
89
-
90
-
91
-
92
-
93
-
94
-
95
-
96
-
97
-
98
-
99
-
100
-
101
-
102
-
103
-
104
-
105
-
106
-
107
-
108
-
109
-
110
-
111
-
112
-
113
-
114
-
115
-
116
-
117
-
118
-
119
-
120
-
121
-
122
-
123
-
124
-
125
-
126
-
127
-
128
-
129
-
130
-
131
-
132
-
133
-
134
-
135
-
136
-
137
-
138
-
139
-
140
-
141
-
142
-
143
-
144
-
145
-
146
-
147
-
148
-
149
-
150
-
 151
151 -
 152
152 -
 153
153 -
 154
154 -
 155
155 -
 156
156 -
 157
157 -
 158
158 -
 159
159 -
 160
160 -
 161
161 -
 162
162 -
 163
163 -
 164
164 -
 165
165 -
 166
166 -
 167
167 -
 168
168 -
 169
169 -
 170
170 -
 171
171 -
172
-
173
-
174
-
175
-
176
-
177
-
178
-
179
-
180
-
181
-
182
-
183
 |
 |

HEWLETT-PACKARD COMPANY AND SUBSIDIARIES
Notes to Consolidated Financial Statements (Continued)
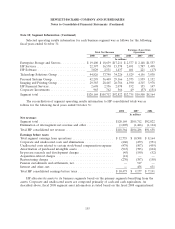
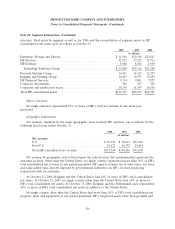
Note 18: Segment Information (Continued)
Selected operating results information for each business segment was as follows for the following
fiscal years ended October 31:
Earnings (Loss) from
Total Net Revenue Operations
2008 2007 2006 2008 2007 2006
In millions
Enterprise Storage and Servers .............. $ 19,400 $ 18,639 $17,211 $ 2,577 $ 2,148 $1,557
HP Services ............................ 22,397 16,570 15,578 2,491 1,787 1,498
HP Software ........................... 3,029 2,531 1,437 461 221 (17)
Technology Solutions Group ................ 44,826 37,740 34,226 5,529 4,156 3,038
Personal Systems Group ................... 42,295 36,409 29,166 2,375 1,939 1,152
Imaging and Printing Group ................ 29,385 28,465 26,786 4,590 4,315 3,978
HP Financial Services ..................... 2,698 2,336 2,078 192 155 147
Corporate Investments .................... 965 762 566 49 (57) (151)
Segment total .......................... $120,169 $105,712 $92,822 $12,735 $10,508 $8,164
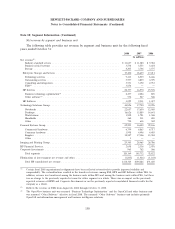
The reconciliation of segment operating results information to HP consolidated totals was as
follows for the following fiscal years ended October 31:
2008 2007 2006
In millions
Net revenue:
Segment total .......................................... $120,169 $105,712 $92,822
Elimination of intersegment net revenue and other ............... (1,805) (1,426) (1,164)
Total HP consolidated net revenue ........................... $118,364 $104,286 $91,658
Earnings before taxes:
Total segment earnings from operations ....................... $ 12,735 $ 10,508 $ 8,164
Corporate and unallocated costs and eliminations ................ (460) (439) (331)
Unallocated costs related to certain stock-based compensation expense (479) (507) (459)
Amortization of purchased intangible assets .................... (967) (783) (604)
In-process research and development charges ................... (45) (190) (52)
Acquisition-related charges ................................ (41) — —
Restructuring charges .................................... (270) (387) (158)
Pension curtailments and settlements, net ...................... — 517 —
Interest and other, net ................................... — 458 631
Total HP consolidated earnings before taxes .................... $ 10,473 $ 9,177 $ 7,191
HP allocates its assets to its business segments based on the primary segments benefiting from the
assets. Corporate and unallocated assets are composed primarily of cash and cash equivalents. As
described above, fiscal 2008 segment asset information is stated based on the fiscal 2008 organizational
155