HP 2008 Annual Report Download - page 64
Download and view the complete annual report
Please find page 64 of the 2008 HP annual report below. You can navigate through the pages in the report by either clicking on the pages listed below, or by using the keyword search tool below to find specific information within the annual report.-
 1
1 -
2
-
3
-
4
-
5
-
6
-
7
-
8
-
9
-
10
-
11
-
12
-
13
-
14
-
15
-
16
-
17
-
18
-
19
-
20
-
21
-
22
-
23
-
24
-
25
-
26
-
27
-
28
-
29
-
30
-
31
-
32
-
33
-
34
-
35
-
36
-
37
-
38
-
39
-
40
-
41
-
42
-
43
-
44
-
45
-
46
-
47
-
48
-
49
-
50
-
51
-
52
-
53
-
 54
54 -
 55
55 -
 56
56 -
 57
57 -
 58
58 -
 59
59 -
 60
60 -
 61
61 -
 62
62 -
 63
63 -
 64
64 -
 65
65 -
 66
66 -
 67
67 -
 68
68 -
 69
69 -
 70
70 -
 71
71 -
 72
72 -
 73
73 -
 74
74 -
75
-
76
-
77
-
78
-
79
-
80
-
81
-
82
-
83
-
84
-
85
-
86
-
87
-
88
-
89
-
90
-
91
-
92
-
93
-
94
-
95
-
96
-
97
-
98
-
99
-
100
-
101
-
102
-
103
-
104
-
105
-
106
-
107
-
108
-
109
-
110
-
111
-
112
-
113
-
114
-
115
-
116
-
117
-
118
-
119
-
120
-
121
-
122
-
123
-
124
-
125
-
126
-
127
-
128
-
129
-
130
-
131
-
132
-
133
-
134
-
135
-
136
-
137
-
138
-
139
-
140
-
141
-
142
-
143
-
144
-
145
-
146
-
147
-
148
-
149
-
150
-
151
-
152
-
153
-
154
-
155
-
156
-
157
-
158
-
159
-
160
-
161
-
162
-
163
-
164
-
165
-
166
-
167
-
168
-
169
-
170
-
171
-
172
-
173
-
174
-
175
-
176
-
177
-
178
-
179
-
180
-
181
-
182
-
183
 |
 |

HEWLETT-PACKARD COMPANY AND SUBSIDIARIES
Management’s Discussion and Analysis of
Financial Condition and Results of Operations (Continued)
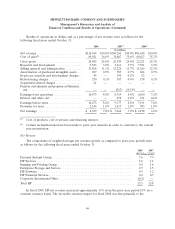
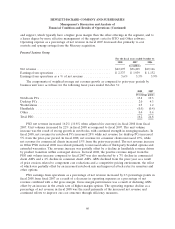
HPS net revenue increased 6.4% in fiscal 2007 from fiscal 2006 (2.6% when adjusted for currency).
In fiscal 2007, the favorable currency impact was due primarily to the movement of the dollar against
the euro. Net revenue in technology services increased 4% in fiscal 2007 from the prior year due
primarily to favorable currency impacts, growth in the IT solution support services and extended
warranty revenue, the impact of which was partially offset by competitive pricing pressures and revenue
erosion from installed base contracts. Net revenue in outsourcing services increased 10% in fiscal 2007
from the prior year. The increase was driven mainly by favorable currency impacts, existing account
growth and new business, which were partially offset by installed base revenue erosion and pricing
pressures. Net revenue in consulting and integration increased 9% in fiscal 2007 from the prior year
due mainly to acquisitions made in fiscal 2007 and favorable currency impacts.
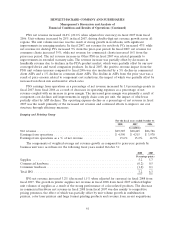
HPS earnings from operations as a percentage of net revenue in fiscal 2007 increased by
1.2 percentage points. The operating margin increase was the result of an increase in gross margin and
a decrease in operating expenses as a percentage of net revenue. The gross margin increase in
fiscal 2007 was due primarily to the continued focus on cost structure improvements generated by
delivery efficiencies and cost controls, the impact of which was partially offset by the impact from the
continued competitive pricing environment. In fiscal 2007, continued efficiency improvements in our
operating expense structure contributed to the decline in operating expenses as a percentage of net
revenue compared to the prior year. Technology services operating margin in fiscal 2007 continued to
benefit from improved delivery efficiencies and cost controls, the impact of which was offset in part by
the impact of the ongoing portfolio mix shift from higher margin proprietary support to lower margin
areas such as IT solution services. Outsourcing services operating margin increased in fiscal 2007 due
primarily to improved delivery efficiencies and reduced operating expenses partially offset by
contractual pricing pressure. Consulting and integration operating margin decreased in fiscal 2007 due
mainly to increased customer project losses and acquisition related costs, the impact of which was
partially offset by more efficient utilization of our consultants and operating expense improvement.
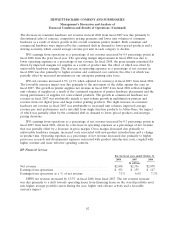
HP Software
For the fiscal years ended October 31
2008 2007 2006
In millions
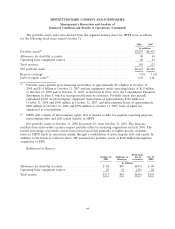
Net revenue ......................................... $3,029 $2,531 $1,437
Earnings (loss) from operations ........................... $ 461 $ 221 $ (17)
Earnings (loss) from operations as a % of net revenue .......... 15.2% 8.7% (1.2)%
58