HP 2008 Annual Report Download - page 59
Download and view the complete annual report
Please find page 59 of the 2008 HP annual report below. You can navigate through the pages in the report by either clicking on the pages listed below, or by using the keyword search tool below to find specific information within the annual report.-
 1
1 -
2
-
3
-
4
-
5
-
6
-
7
-
8
-
9
-
10
-
11
-
12
-
13
-
14
-
15
-
16
-
17
-
18
-
19
-
20
-
21
-
22
-
23
-
24
-
25
-
26
-
27
-
28
-
29
-
30
-
31
-
32
-
33
-
34
-
35
-
36
-
37
-
38
-
39
-
40
-
41
-
42
-
43
-
44
-
45
-
46
-
47
-
48
-
 49
49 -
 50
50 -
 51
51 -
 52
52 -
 53
53 -
 54
54 -
 55
55 -
 56
56 -
 57
57 -
 58
58 -
 59
59 -
 60
60 -
 61
61 -
 62
62 -
 63
63 -
 64
64 -
 65
65 -
 66
66 -
 67
67 -
 68
68 -
 69
69 -
70
-
71
-
72
-
73
-
74
-
75
-
76
-
77
-
78
-
79
-
80
-
81
-
82
-
83
-
84
-
85
-
86
-
87
-
88
-
89
-
90
-
91
-
92
-
93
-
94
-
95
-
96
-
97
-
98
-
99
-
100
-
101
-
102
-
103
-
104
-
105
-
106
-
107
-
108
-
109
-
110
-
111
-
112
-
113
-
114
-
115
-
116
-
117
-
118
-
119
-
120
-
121
-
122
-
123
-
124
-
125
-
126
-
127
-
128
-
129
-
130
-
131
-
132
-
133
-
134
-
135
-
136
-
137
-
138
-
139
-
140
-
141
-
142
-
143
-
144
-
145
-
146
-
147
-
148
-
149
-
150
-
151
-
152
-
153
-
154
-
155
-
156
-
157
-
158
-
159
-
160
-
161
-
162
-
163
-
164
-
165
-
166
-
167
-
168
-
169
-
170
-
171
-
172
-
173
-
174
-
175
-
176
-
177
-
178
-
179
-
180
-
181
-
182
-
183
 |
 |
HEWLETT-PACKARD COMPANY AND SUBSIDIARIES
Management’s Discussion and Analysis of
Financial Condition and Results of Operations (Continued)
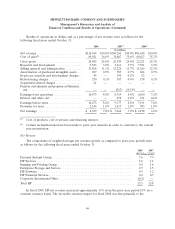
HPS, PSG and IPG segments experienced a year-over-year decrease in SG&A expense as a percentage
of net revenue during fiscal 2007, while HP Software experienced a year-over-year increase in SG&A
expense.
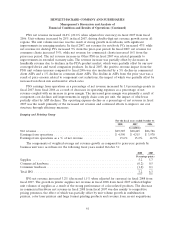
Amortization of Purchased Intangible Assets
The increase in amortization expense during fiscal 2008 as compared to fiscal 2007 was due
primarily to amortization expenses related to the EDS acquisition as well as other acquisitions made in
fiscal 2008.
The increase in amortization expense in fiscal 2007 as compared to fiscal 2006 was due primarily
to amortization expense related to the acquisition of Mercury in the first quarter of fiscal 2007. This
increase was partially offset by a decrease in amortization expense related to certain intangible assets
associated with prior acquisitions, including the Compaq Computer Corporation (‘‘Compaq’’)
acquisition, that had reached the end of their amortization period.
For more information on our amortization of purchased intangibles assets, see Note 7 to the
Consolidated Financial Statements in Item 8, which is incorporated herein by reference.
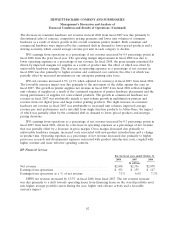
In-Process Research and Development Charges
We record in-process research and development (‘‘IPR&D’’) charges in connection with
acquisitions accounted for as business combinations as more fully described in Note 6 to the
Consolidated Financial Statements in Item 8. In fiscal 2008, 2007 and 2006 we recorded IPR&D
charges of $45 million, $190 million and $52 million, respectively, related to acquisitions. The decrease
in IPR&D in fiscal 2008 was due primarily to higher IPR&D expenses in the prior year as a result of
our acquisition of Mercury in the first quarter of fiscal 2007.
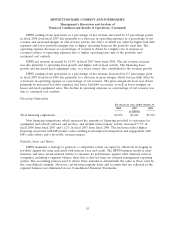
Restructuring Charges
Restructuring charges for fiscal 2008 were $270 million, which included $246 million of charges due
primarily to severance and facility costs related to the EDS acquisition and a net charge of $24 million
relating to adjustments for existing restructuring programs.
Restructuring charges for fiscal 2007 were $387 million, which included $354 million of expenses
related to severance and other benefit costs associated with those employees who elected to participate
in the early retirement program implemented in fiscal 2007 and a net charge of $33 million relating to
adjustments to our previous restructuring programs.
Restructuring charges in fiscal year 2006 were $158 million. This included a net charge of
$233 million related to true-ups of severance and other related restructuring charges for all
restructuring plans, a $6 million termination benefits expense and a $3 million settlement and
curtailment loss from our non-U.S. pension plans related to the fiscal 2005 restructuring plan approved
by our Board of Directors in the fourth quarter of fiscal 2005. These charges were partially offset by a
$46 million settlement gain from the U.S. pension plans, a $24 million curtailment gain from the U.S.
retiree medical program and a $14 million adjustment to reduce our non-cash stock-based
compensation expense, all related to our fiscal 2005 restructuring plan.
For more information on our restructuring charges, see Note 8 to the Consolidated Financial
Statements in Item 8, which is incorporated herein by reference.
53