HP 2008 Annual Report Download - page 65
Download and view the complete annual report
Please find page 65 of the 2008 HP annual report below. You can navigate through the pages in the report by either clicking on the pages listed below, or by using the keyword search tool below to find specific information within the annual report.-
 1
1 -
2
-
3
-
4
-
5
-
6
-
7
-
8
-
9
-
10
-
11
-
12
-
13
-
14
-
15
-
16
-
17
-
18
-
19
-
20
-
21
-
22
-
23
-
24
-
25
-
26
-
27
-
28
-
29
-
30
-
31
-
32
-
33
-
34
-
35
-
36
-
37
-
38
-
39
-
40
-
41
-
42
-
43
-
44
-
45
-
46
-
47
-
48
-
49
-
50
-
51
-
52
-
53
-
54
-
 55
55 -
 56
56 -
 57
57 -
 58
58 -
 59
59 -
 60
60 -
 61
61 -
 62
62 -
 63
63 -
 64
64 -
 65
65 -
 66
66 -
 67
67 -
 68
68 -
 69
69 -
 70
70 -
 71
71 -
 72
72 -
 73
73 -
 74
74 -
 75
75 -
76
-
77
-
78
-
79
-
80
-
81
-
82
-
83
-
84
-
85
-
86
-
87
-
88
-
89
-
90
-
91
-
92
-
93
-
94
-
95
-
96
-
97
-
98
-
99
-
100
-
101
-
102
-
103
-
104
-
105
-
106
-
107
-
108
-
109
-
110
-
111
-
112
-
113
-
114
-
115
-
116
-
117
-
118
-
119
-
120
-
121
-
122
-
123
-
124
-
125
-
126
-
127
-
128
-
129
-
130
-
131
-
132
-
133
-
134
-
135
-
136
-
137
-
138
-
139
-
140
-
141
-
142
-
143
-
144
-
145
-
146
-
147
-
148
-
149
-
150
-
151
-
152
-
153
-
154
-
155
-
156
-
157
-
158
-
159
-
160
-
161
-
162
-
163
-
164
-
165
-
166
-
167
-
168
-
169
-
170
-
171
-
172
-
173
-
174
-
175
-
176
-
177
-
178
-
179
-
180
-
181
-
182
-
183
 |
 |

HEWLETT-PACKARD COMPANY AND SUBSIDIARIES
Management’s Discussion and Analysis of
Financial Condition and Results of Operations (Continued)
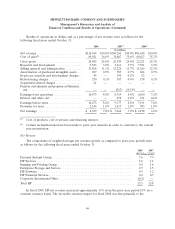
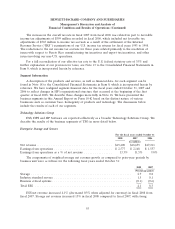
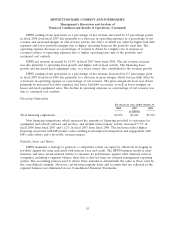
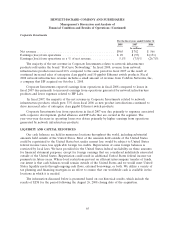
The components of weighted-average net revenue growth as compared to the prior-year periods by
business unit were as follows for the following fiscal years ended October 31:
2008 2007
Percentage points
Business technology optimization(1) ...................................... 19.5 77.6
Other software(1) ................................................... 0.2 (1.5)
Total HP Software .................................................. 19.7 76.1
(1) Effective in fiscal 2008 the OpenView business unit was renamed ‘‘Business technology
optimization’’ (‘‘BTO’’) and the OpenCall and Other business unit was renamed ‘‘Other software.’’
The renamed ‘‘Other software’’ business unit includes primarily OpenCall and business information
optimization products.
HP Software net revenue increased 19.7% (14.4% when adjusted for currency) in fiscal 2008 from
fiscal 2007. Net revenue from BTO increased 25% in fiscal 2008 as compared to fiscal 2007. BTO net
revenue growth in fiscal 2008 was driven by increases in support, higher license revenue due in part to
the Opsware acquisition, and increases in services contracts. Net revenue from Other software
increased by 1% in fiscal 2008 as compared to fiscal 2007. The growth in Other software net revenue in
fiscal 2008 was attributable primarily to the growth in the information management business due in part
to our acquisition of Tower Software in May 2008, when growth was partially offset by a decline in
OpenCall net revenue resulting from a competitive environment following industry consolidation and
the transfer of some hardware revenues to ESS due to a platform shift.
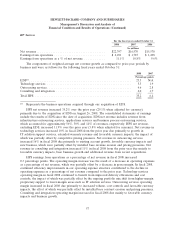
HP Software earnings from operations as a percentage of net revenue increased by 6.5 percentage
points in fiscal 2008 as compared to fiscal 2007. The operating margin increase in fiscal 2008 was the
result of a combination of an increase in gross margin and a decrease in operating expenses as a
percentage of net revenue. The increase in gross margin in fiscal 2008 was due primarily to cost savings
in the BTO business, cost structure improvements as a result of increased scale in the information
management business and, to a lesser extent, a favorable change in the revenue mix driven by higher
revenues from the BTO business, which typically has higher gross margins than the remainder of the
segment. The decrease in operating expenses as a percentage of net revenue in fiscal 2008 was due
primarily to continued cost controls, the effect of which was partially offset by increased field selling
costs driven by sales force investments.
HP Software net revenue increased 76.1% (72.8% when adjusted for currency) in fiscal 2007 as
compared to fiscal 2006. The favorable currency impact was due primarily to the movement of the
dollar against the euro. Excluding the results of Mercury, HP Software’s revenue grew 9.6% in fiscal
2007. Net revenue associated with the acquisition of Mercury was included in the results of BTO, which
increased 125% in fiscal 2007 and 18% in the same respective period without Mercury. BTO net
revenue growth also was the result of increases in revenue from license and support contracts. Net
revenue for Other software decreased 4% in fiscal 2007. The decrease in Other software net revenue
was due primarily to a platform shift that resulted in a transfer of the hardware revenue to ESS.
The operating margin improvement of 9.9 percentage points in fiscal 2007 as compared to fiscal
2006 was the result primarily of an increase in gross margin and to a lesser degree a decrease in
operating expense as a percentage of net revenue. In fiscal 2007, the improvement in gross margin was
a result of a favorable change in revenue mix driven by the inclusion of revenue from Mercury licenses
59