GameStop 2003 Annual Report Download - page 63
Download and view the complete annual report
Please find page 63 of the 2003 GameStop annual report below. You can navigate through the pages in the report by either clicking on the pages listed below, or by using the keyword search tool below to find specific information within the annual report.-
 1
1 -
2
-
3
-
4
-
5
-
6
-
7
-
8
-
9
-
10
-
11
-
12
-
13
-
14
-
15
-
16
-
17
-
18
-
19
-
20
-
21
-
22
-
23
-
24
-
25
-
26
-
27
-
28
-
29
-
30
-
31
-
32
-
33
-
34
-
35
-
36
-
37
-
38
-
39
-
40
-
41
-
42
-
43
-
44
-
45
-
46
-
47
-
48
-
49
-
50
-
51
-
52
-
 53
53 -
 54
54 -
 55
55 -
 56
56 -
 57
57 -
 58
58 -
 59
59 -
 60
60 -
 61
61 -
 62
62 -
 63
63 -
 64
64 -
 65
65 -
 66
66 -
 67
67 -
 68
68 -
 69
69 -
 70
70 -
 71
71 -
 72
72 -
 73
73 -
74
-
75
-
76
-
77
-
78
-
79
-
80
 |
 |

Table of Contents
GAMESTOP CORP.
NOTES TO CONSOLIDATED FINANCIAL STATEMENTS — (Continued)
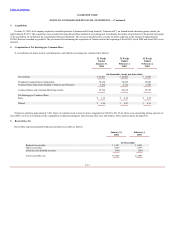
17. Repurchase of Equity Securities
In March 2003, the Board of Directors authorized a common stock repurchase program for the purchase of up to $50,000 of the Company’s Class A common
shares. The Company may repurchase shares from time to time in the open market or through privately negotiated transactions, depending on prevailing market
conditions and other factors. The repurchased shares will be held in treasury. During the 52 weeks ended January 31, 2004, the Company repurchased 2,304 shares at an
average share price of $15.19.
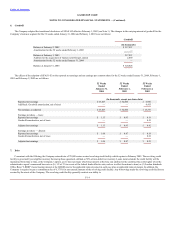
18. Subsequent Events
In March 2004, the Company purchased a 420 square foot facility in Grapevine, Texas. The Company will be relocating certain of our distribution operations to
this facility in fiscal 2004 and will be relocating our headquarters and remaining distribution center operations to this facility in early 2005. The Company expects that
the total cost to purchase, improve and equip this facility will be approximately $29,000. Management believes this facility will support our long-term growth.
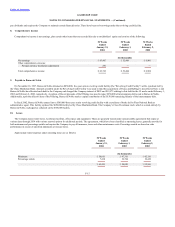
19. Unaudited Quarterly Financial Information
The following table sets forth certain unaudited quarterly consolidated statement of operations information for the fiscal years ended January 31, 2004 and
February 1, 2003. The unaudited quarterly information includes all normal recurring adjustments that management considers necessary for a fair presentation of the
information shown.
Fiscal Year Ended January 31, 2004 Fiscal Year Ended February 1, 2003
1st 2nd 3rd 4th 1st 2nd 3rd 4th
Quarter Quarter Quarter Quarter Quarter Quarter Quarter Quarter
(In thousands)
Sales $321,741 $305,674 $326,042 $625,381 $271,405 $274,262 $286,728 $520,396
Gross profit 85,441 88,983 98,474 163,676 69,091 73,445 73,845 126,919
Operating earnings 10,689 10,849 17,891 64,955 8,714 9,863 15,982 52,512
Net earnings 6,611 6,606 10,693 39,557 4,914 6,118 9,785 31,587
Net earnings per common
share — basic 0.12 0.12 0.19 0.71 0.09 0.11 0.17 0.55
Net earnings per common
share — diluted 0.11
0.11 0.18 0.67 0.08 0.10 0.16 0.52
F-21