GameStop 2003 Annual Report Download - page 30
Download and view the complete annual report
Please find page 30 of the 2003 GameStop annual report below. You can navigate through the pages in the report by either clicking on the pages listed below, or by using the keyword search tool below to find specific information within the annual report.-
 1
1 -
2
-
3
-
4
-
5
-
6
-
7
-
8
-
9
-
10
-
11
-
12
-
13
-
14
-
15
-
16
-
17
-
18
-
19
-
 20
20 -
 21
21 -
 22
22 -
 23
23 -
 24
24 -
 25
25 -
 26
26 -
 27
27 -
 28
28 -
 29
29 -
 30
30 -
 31
31 -
 32
32 -
 33
33 -
 34
34 -
 35
35 -
 36
36 -
 37
37 -
 38
38 -
 39
39 -
 40
40 -
41
-
42
-
43
-
44
-
45
-
46
-
47
-
48
-
49
-
50
-
51
-
52
-
53
-
54
-
55
-
56
-
57
-
58
-
59
-
60
-
61
-
62
-
63
-
64
-
65
-
66
-
67
-
68
-
69
-
70
-
71
-
72
-
73
-
74
-
75
-
76
-
77
-
78
-
79
-
80
 |
 |
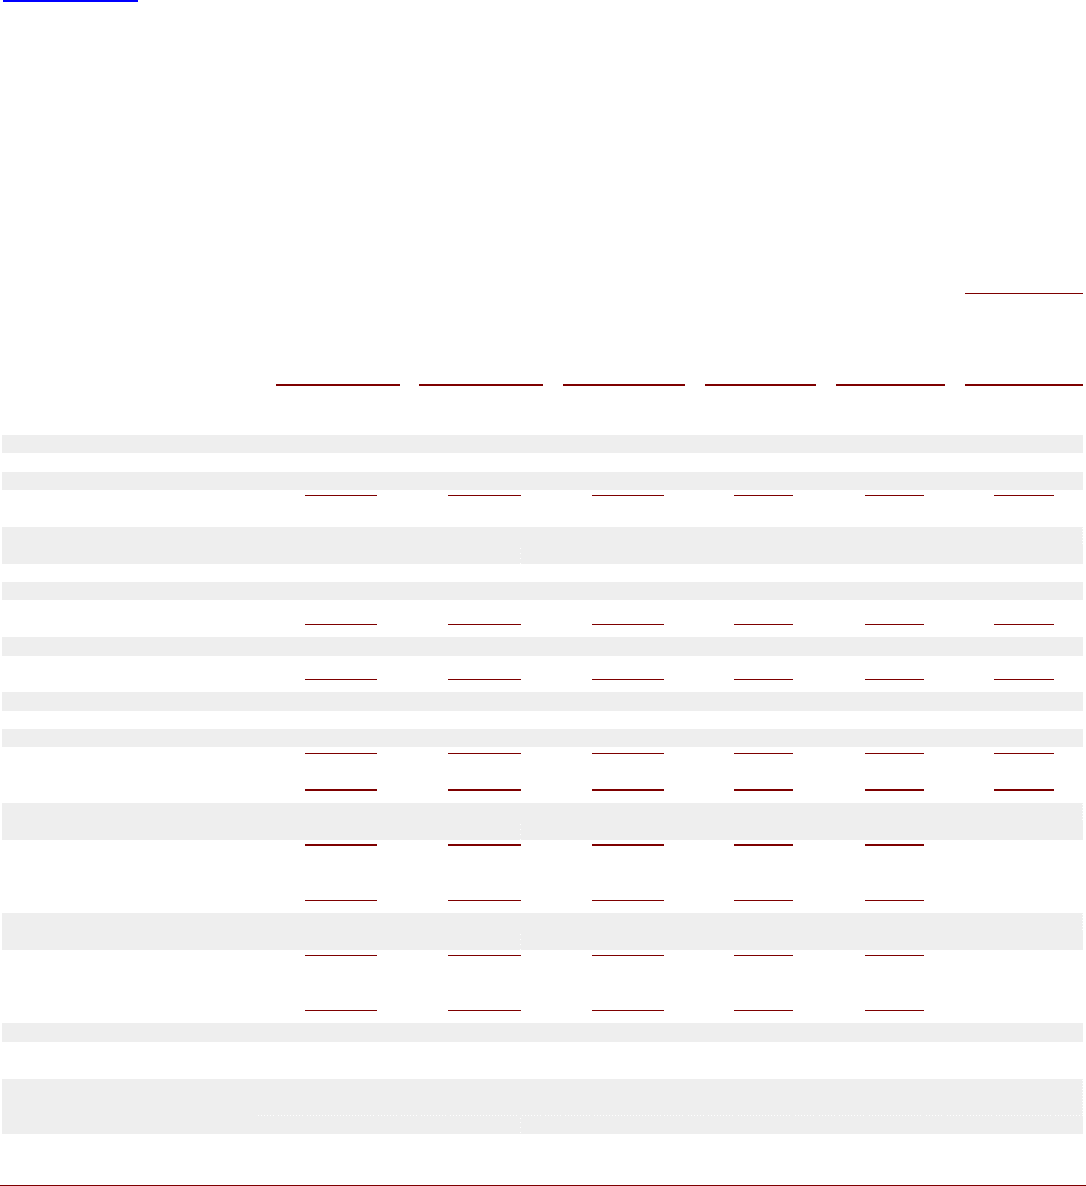
Table of Contents
“Balance Sheet Data” as of February 2, 2002, February 3, 2001 and January 29, 2000 are derived from our audited financial statements which are not included
elsewhere in this Form 10-K.
Our wholly-owned subsidiary Babbage’s Etc. LLC (“Babbage’s”) began operations in November 1996. In October 1999, Babbage’s was acquired by, and became
a wholly-owned subsidiary of, Barnes & Noble. Because our financial statements subsequent to the acquisition by Barnes & Noble are not directly comparable to those
prior to the acquisition, our audited financial statements for the period ended January 29, 2000, which are not included elsewhere in this Form 10-K, and the following
table make a distinction between the “predecessor company” and the “successor company.” In June 2000, Barnes & Noble acquired Funco, Inc. (“Funco”) and
thereafter, Babbage’s became a wholly-owned subsidiary of Funco. The acquisition of Funco has been accounted for under the purchase method of accounting. In
December 2000, Funco changed its name to GameStop, Inc.
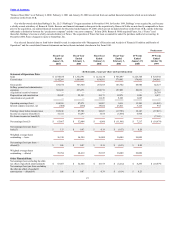
Our selected financial data set forth below should be read in conjunction with “Management’s Discussion and Analysis of Financial Condition and Results of
Operations” and the consolidated financial statements and notes thereto included elsewhere in this Form 10-K.
Predecessor
Fiscal Year Fiscal Year Fiscal Year Fiscal Year 13 Weeks 39 Weeks
Ended Ended Ended Ended Ended Ended
January 31, February 1, February 2, February 3, January 29, October 30,
2004 2003 2002 2001 2000 1999
(In thousands, except per share and operating data)
Statement of Operations Data:
Sales $ 1,578,838 $ 1,352,791 $ 1,121,138 $ 756,697 $ 223,748 $ 329,392
Cost of sales 1,142,264 1,009,491 854,035 570,995 174,808 246,865
Gross profit 436,574 343,300 267,103 185,702 48,940 82,527
Selling, general and administrative
expenses 303,243 233,676 202,719 157,891 30,019 68,112
Acquisition incentive bonuses — — —
—
— 26,789
Depreciation and amortization 28,947 22,553 19,172 12,974 1,926 4,475
Amortization of goodwill — — 11,125 9,223 1,687
—
Operating earnings (loss) 104,384 87,071 34,087 5,614 15,308 (16,849)
Interest expense (income), net (804 ) (630) 19,452 23,411 3,123 972
Earnings (loss) before income taxes 105,188 87,701 14,635 (17,797) 12,185 (17,821)
Income tax expense (benefit)(1) 41,721 35,297 7,675 (5,836) 4,968
—
Pro forma income tax benefit(2) — — —
—
— (7,142)
Net earnings (loss)(3) $ 63,467 $ 52,404 $ 6,960 $ (11,961) $ 7,217 $ (10,679)
Net earnings (loss) per share —
basic(3) $1.13 $0.93 $0.19 $(0.33) $0.20
Weighted average shares
outstanding — basic 56,330
56,289 36,009 36,009 36,009
Net earnings (loss) per share —
diluted(3) $1.06 $0.87 $0.18 $(0.33) $0.20
Weighted average shares
outstanding — diluted 59,764
60,419 39,397 36,009 36,009
Other Financial Data:
Net earnings (loss) excluding the after-
tax effect of goodwill amortization(4) $ 63,467
$ 52,404 $ 15,373 $ (5,212) $ 8,295 $ (10,679)
Net earnings (loss) per share excluding
the after-tax effect of goodwill
amortization — diluted(4) $1.06 $0.87 $0.39 $(0.14) $0.23
21