GameStop 2003 Annual Report Download - page 6
Download and view the complete annual report
Please find page 6 of the 2003 GameStop annual report below. You can navigate through the pages in the report by either clicking on the pages listed below, or by using the keyword search tool below to find specific information within the annual report.-
 1
1 -
 2
2 -
 3
3 -
 4
4 -
 5
5 -
 6
6 -
 7
7 -
 8
8 -
 9
9 -
 10
10 -
 11
11 -
 12
12 -
 13
13 -
 14
14 -
 15
15 -
 16
16 -
 17
17 -
18
-
19
-
20
-
21
-
22
-
23
-
24
-
25
-
26
-
27
-
28
-
29
-
30
-
31
-
32
-
33
-
34
-
35
-
36
-
37
-
38
-
39
-
40
-
41
-
42
-
43
-
44
-
45
-
46
-
47
-
48
-
49
-
50
-
51
-
52
-
53
-
54
-
55
-
56
-
57
-
58
-
59
-
60
-
61
-
62
-
63
-
64
-
65
-
66
-
67
-
68
-
69
-
70
-
71
-
72
-
73
-
74
-
75
-
76
-
77
-
78
-
79
-
80
 |
 |
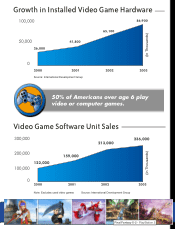
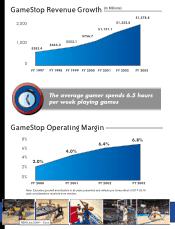
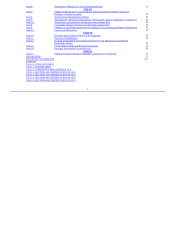
2,000
1,000
0
$383.4
$465.2
$553.1
$756.7
$1,121.1
$1,352.8
$1,578.8
FY 1997 FY 1998 FY 1999 FY 2000 FY 2001 FY 2002 FY 2003
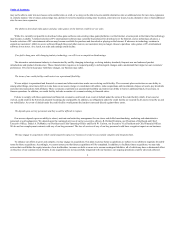
0%
2%
4%
6%
8%
FY 2000 FY 2001 FY 2002 FY 2003
2.0%
4.0%
6.4% 6.8%
GameStop Operating Margin
GameStop Revenue Growth
The average gamer spends 6.5 hours
per week playing games
(InMillions)
Note:ExcludesgoodwillamortizationinallyearspresentedandreflectsproformaeffectofEITF02-16
cashconsiderationsreceivedfromvendors
NBALive2004-Xbox