GameStop 2003 Annual Report Download - page 46
Download and view the complete annual report
Please find page 46 of the 2003 GameStop annual report below. You can navigate through the pages in the report by either clicking on the pages listed below, or by using the keyword search tool below to find specific information within the annual report.-
 1
1 -
2
-
3
-
4
-
5
-
6
-
7
-
8
-
9
-
10
-
11
-
12
-
13
-
14
-
15
-
16
-
17
-
18
-
19
-
20
-
21
-
22
-
23
-
24
-
25
-
26
-
27
-
28
-
29
-
30
-
31
-
32
-
33
-
34
-
35
-
 36
36 -
 37
37 -
 38
38 -
 39
39 -
 40
40 -
 41
41 -
 42
42 -
 43
43 -
 44
44 -
 45
45 -
 46
46 -
 47
47 -
 48
48 -
 49
49 -
 50
50 -
 51
51 -
 52
52 -
 53
53 -
 54
54 -
 55
55 -
 56
56 -
57
-
58
-
59
-
60
-
61
-
62
-
63
-
64
-
65
-
66
-
67
-
68
-
69
-
70
-
71
-
72
-
73
-
74
-
75
-
76
-
77
-
78
-
79
-
80
 |
 |

Table of Contents
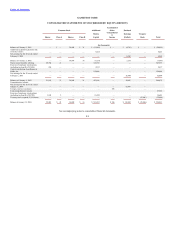
GAMESTOP CORP.
CONSOLIDATED STATEMENTS OF OPERATIONS
52 Weeks 52 Weeks 52 Weeks
Ended Ended Ended
January 31, February 1, February 2,
2004 2003 2002
(In thousands, except per share data)
Sales $1,578,838 $1,352,791 $1,121,138
Cost of sales 1,142,264 1,009,491 854,035
Gross profit 436,574 343,300 267,103
Selling, general and administrative expenses 303,243 233,676 202,719
Depreciation and amortization 28,947 22,553 19,172
Amortization of goodwill
—
—
11,125
Operating earnings 104,384 87,071 34,087
Interest income (1,467) (1,998) (123)
Interest expense 663 1,368 19,575
Earnings before income tax expense 105,188 87,701 14,635
Income tax expense 41,721 35,297 7,675
Net earnings $ 63,467 $ 52,404 $ 6,960
Net earnings per common share — basic $1.13 $0.93 $0.19
Weighted average shares of common stock — basic 56,330 56,289 36,009
Net earnings per common share — diluted $1.06 $0.87 $0.18
Weighted average shares of common stock — diluted 59,764 60,419 39,397
See accompanying notes to consolidated financial statements.
F-4