GameStop 2003 Annual Report Download - page 48
Download and view the complete annual report
Please find page 48 of the 2003 GameStop annual report below. You can navigate through the pages in the report by either clicking on the pages listed below, or by using the keyword search tool below to find specific information within the annual report.-
 1
1 -
2
-
3
-
4
-
5
-
6
-
7
-
8
-
9
-
10
-
11
-
12
-
13
-
14
-
15
-
16
-
17
-
18
-
19
-
20
-
21
-
22
-
23
-
24
-
25
-
26
-
27
-
28
-
29
-
30
-
31
-
32
-
33
-
34
-
35
-
36
-
37
-
 38
38 -
 39
39 -
 40
40 -
 41
41 -
 42
42 -
 43
43 -
 44
44 -
 45
45 -
 46
46 -
 47
47 -
 48
48 -
 49
49 -
 50
50 -
 51
51 -
 52
52 -
 53
53 -
 54
54 -
 55
55 -
 56
56 -
 57
57 -
 58
58 -
59
-
60
-
61
-
62
-
63
-
64
-
65
-
66
-
67
-
68
-
69
-
70
-
71
-
72
-
73
-
74
-
75
-
76
-
77
-
78
-
79
-
80
 |
 |

Table of Contents
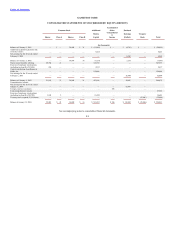
GAMESTOP CORP.
CONSOLIDATED STATEMENTS OF CASH FLOWS
52 Weeks 52 Weeks 52 Weeks
Ended Ended Ended
January 31, February 1, February 2,
2004 2003 2002
(In thousands)
Cash flows from operating activities:
Net earnings $ 63,467 $ 52,404 $ 6,960
Adjustments to reconcile net earnings to net cash flows provided by
operating activities:
Depreciation and amortization 28,947 22,553 19,172
Amortization of goodwill —
—
11,125
Amortization of loan cost 313 242
—
Deferred taxes 5,713 4,710 319
Tax benefit realized from exercise of stock options by employees 9,702 1,906
—
Loss on disposal of property and equipment 213 205 1,035
Increase in other long-term liabilities for scheduled rent increases in
long-term leases 338 329 347
Minority interest (298)
—
—
Changes in operating assets and liabilities, net
Receivables, net (1,954) (963) (2,204)
Merchandise inventories (59,811) (23,018) (29,498)
Prepaid expenses and other current assets (4,111) (1,872) 5,427
Prepaid taxes (12,775)
—
—
Accounts payable, accrued liabilities and accrued income taxes
payable 40,056 36,374 65,436
Net cash flows provided by operating activities 69,800 92,870 78,119
Cash flows from investing activities:
Purchase of property and equipment (63,007) (39,529) (20,462)
Acquisition of controlling interest in Gamesworld Group Limited, net of
cash received (3,027)
—
—
Net increase in other noncurrent assets (522) (788) (23)
Net cash flows used in investing activities (66,556) (40,317) (20,485)
Cash flows from financing activities:
Issuance of 20,764 shares relating to the public offering, net of the related
expenses — 347,339
—
Issuance of shares relating to employee stock options 6,899 1,011
—
Repayment of debt due to Barnes & Noble, Inc. — (250,000)
—
Repayment of debt of Gamesworld Group Limited (2,296)
—
—
Purchase of treasury shares through repurchase program (35,006)
—
—
Net increase in other payable to Barnes & Noble, Inc. — 377 14,475
Net cash flows (used in) provided by financing activities (30,403) 98,727 14,475
Exchange rate effect on cash and cash equivalents 34
—
—
Net increase (decrease) in cash and cash equivalents (27,125) 151,280 72,109
Cash and cash equivalents at beginning of period 232,030 80,750 8,641
Cash and cash equivalents at end of period $204,905 $232,030 $80,750
See accompanying notes to consolidated financial statements.
F-6