GameStop 2003 Annual Report Download - page 34
Download and view the complete annual report
Please find page 34 of the 2003 GameStop annual report below. You can navigate through the pages in the report by either clicking on the pages listed below, or by using the keyword search tool below to find specific information within the annual report.-
 1
1 -
2
-
3
-
4
-
5
-
6
-
7
-
8
-
9
-
10
-
11
-
12
-
13
-
14
-
15
-
16
-
17
-
18
-
19
-
20
-
21
-
22
-
23
-
 24
24 -
 25
25 -
 26
26 -
 27
27 -
 28
28 -
 29
29 -
 30
30 -
 31
31 -
 32
32 -
 33
33 -
 34
34 -
 35
35 -
 36
36 -
 37
37 -
 38
38 -
 39
39 -
 40
40 -
 41
41 -
 42
42 -
 43
43 -
 44
44 -
45
-
46
-
47
-
48
-
49
-
50
-
51
-
52
-
53
-
54
-
55
-
56
-
57
-
58
-
59
-
60
-
61
-
62
-
63
-
64
-
65
-
66
-
67
-
68
-
69
-
70
-
71
-
72
-
73
-
74
-
75
-
76
-
77
-
78
-
79
-
80
 |
 |

Table of Contents
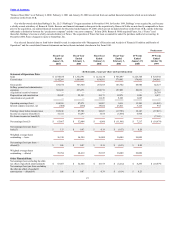
Results of Operations
The following table sets forth certain income statement items as a percentage of sales for the periods indicated:
Fiscal Year Fiscal Year Fiscal Year
Ended Ended Ended
January 31, February 1, February 2,
2004 2003 2002
Statement of Operations Data:
Sales 100.0% 100.0% 100.0%
Cost of sales 72.4 74.6 76.2
Gross profit 27.6 25.4 23.8
Selling, general and administrative expenses 19.2 17.3 18.1
Depreciation and amortization 1.8 1.7 1.7
Amortization of goodwill 0.0 0.0 1.0
Operating earnings 6.6 6.4 3.0
Interest expense, net 0.0 (0.1) 1.7
Earnings before income taxes 6.6 6.5 1.3
Income tax expense 2.6 2.6 0.7
Net earnings 4.0% 3.9% 0.6%
Fiscal 2003 Compared to Fiscal 2002
Sales increased by $226.0 million, or 16.7%, from $1,352.8 million in fiscal 2002 to $1,578.8 million in fiscal 2003. The increase in sales was primarily
attributable to the additional sales resulting from 283 net new stores opened since February 1, 2003 and to a 0.8% increase in comparable store sales. Stores are included
in our comparable store sales base beginning in the thirteenth month of operation. Comparable store sales increased a modest 0.8% as declining video game hardware
price points offset a significant increase in video game software sales.
Cost of sales increased by $132.8 million, or 13.2%, from $1,009.5 million in fiscal 2002 to $1,142.3 million in fiscal 2003. Cost of sales as a percentage of sales
decreased from 74.6% in fiscal 2002 to 72.4% in fiscal 2003. This decrease was primarily the result of the implementation of EITF 02-16 (see footnote 2 to the
Consolidated Financial Statements), requiring certain vendor allowances to be deducted from cost of sales, and the shift in sales mix from lower margin video game
hardware to higher margin PlayStation 2, Game Boy Advance, Xbox and GameCube video game software and used video game products. The implementation of
EITF 02-16 led to a decrease in cost of sales of $21.6 million, or 1.4% of sales.
Selling, general and administrative expenses increased by $69.5 million, or 29.7%, from $233.7 million in fiscal 2002 to $303.2 million in fiscal 2003. The increase
was primarily attributable to the increase in the number of stores in operation and the related increases in store, distribution, and corporate office operating expenses. In
addition, implementing EITF 02-16 caused an increase of $26.8 million in selling, general and administrative expenses. Selling, general and administrative expenses as
a percentage of sales increased from 17.3% in fiscal 2002 to 19.2% in fiscal 2003. The increase in selling, general and administrative expenses as a percentage of sales
was primarily due to the effect of implementing EITF 02-16.
Depreciation and amortization expense increased from $22.6 million in fiscal 2002 to $28.9 million in fiscal 2003. This increase of $6.3 million was due to the
capital expenditures for new stores, management information systems and distribution center enhancements during the fiscal year.
Interest income resulting from the investment of excess cash balances decreased from $2.0 million in fiscal 2002 to $1.5 million in fiscal 2003 due to a decrease in
the level of investments and the average yield on the investments. Interest expense decreased by $0.7 million, from $1.4 million in fiscal 2002 to $0.7 million in
25