GameStop 2003 Annual Report Download - page 36
Download and view the complete annual report
Please find page 36 of the 2003 GameStop annual report below. You can navigate through the pages in the report by either clicking on the pages listed below, or by using the keyword search tool below to find specific information within the annual report.-
 1
1 -
2
-
3
-
4
-
5
-
6
-
7
-
8
-
9
-
10
-
11
-
12
-
13
-
14
-
15
-
16
-
17
-
18
-
19
-
20
-
21
-
22
-
23
-
24
-
25
-
 26
26 -
 27
27 -
 28
28 -
 29
29 -
 30
30 -
 31
31 -
 32
32 -
 33
33 -
 34
34 -
 35
35 -
 36
36 -
 37
37 -
 38
38 -
 39
39 -
 40
40 -
 41
41 -
 42
42 -
 43
43 -
 44
44 -
 45
45 -
 46
46 -
47
-
48
-
49
-
50
-
51
-
52
-
53
-
54
-
55
-
56
-
57
-
58
-
59
-
60
-
61
-
62
-
63
-
64
-
65
-
66
-
67
-
68
-
69
-
70
-
71
-
72
-
73
-
74
-
75
-
76
-
77
-
78
-
79
-
80
 |
 |

Table of Contents
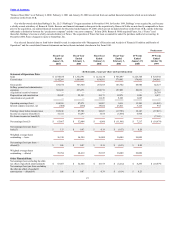
Income tax expense increased by $27.6 million, from $7.7 million in fiscal 2001 to $35.3 million in fiscal 2002. The Company’s effective tax rate decreased from
52.4% in fiscal 2001 to 40.2% in fiscal 2002 due to the elimination of the amortization of goodwill in accordance with SFAS 142. The amortization of goodwill
associated with the Funco acquisition is not deductible for tax purposes and led to an increase in our effective tax rate in fiscal 2001 of 10.5% compared to fiscal 2002.
See Note 12 of “Notes to Consolidated Financial Statements” of the Company for additional information regarding income taxes.
The factors described above led to an increase in operating earnings of $53.0 million, or 155.4%, from $34.1 million in fiscal 2001 to $87.1 million in fiscal 2002
and an increase in net earnings of $45.4 million, or 648.6%, from $7.0 million in fiscal 2001 to $52.4 million in fiscal 2002.
Liquidity and Capital Resources
Subsequent to our acquisition by Barnes & Noble in October 1999, and prior to our initial public offering on February 12, 2002, our operations were funded by
cash flows from operations and advances from Barnes & Noble. Those advances were treated as an intercompany loan owed to Barnes & Noble by us. As of
February 2, 2002, we were indebted to Barnes & Noble in the amount of $399.6 million.
On February 12, 2002, we registered and sold an aggregate of 20,763,888 shares of our Class A common stock at a price of $18.00 per share. The aggregate price
of the offering amount registered and sold was approximately $373.7 million. The net proceeds from the initial public offering were $347.3 million. A portion of the
proceeds was used to repay $250.0 million of our indebtedness to Barnes & Noble. Upon closing the initial public offering, Barnes & Noble contributed the difference
between the aggregate amount of the intercompany loans and $250.0 million as additional paid-in-capital. The amount of the capital contribution was $150.0 million.
Of the balance of the proceeds (approximately $97.3 million), approximately $33.8 million was used for capital expenditures and the remainder was used for working
capital and general corporate purposes.
The combination of the net proceeds of the initial public offering of $347.3 million, the contribution of $150.0 million to additional paid-in-capital by Barnes &
Noble and net earnings of $52.4 million in fiscal 2002 all led to an increase in stockholders’ equity from a deficit of $4.0 million as of February 2, 2002 to
$548.7 million as of February 1, 2003.
During fiscal 2003, cash provided by operations was $69.8 million, compared to cash provided by operations of $92.9 million in fiscal 2002. The decrease in cash
provided by operations of $23.1 million from fiscal 2002 to fiscal 2003 was primarily due to the payment in fiscal 2003 of income taxes payable of $15.8 million
outstanding as of the end of fiscal 2002 and the payment of income taxes estimated to be due for fiscal 2003. In addition, in fiscal 2003, the Company invested in
merchandise inventories to support the overall growth of the Company and the anticipated store openings in early fiscal 2004. In fiscal 2003, cash provided by
operations was primarily due to net income of $63.5 million, depreciation and amortization of $28.9 million and an increase in accounts payable of $40.0 million, which
were offset partially by an increase in merchandise inventories of $59.8 million. In fiscal 2002, cash provided by operations was primarily due to net income of
$52.4 million, depreciation and amortization of $22.6 million and an increase in accounts payable of $36.4 million, which were offset partially by an increase in
merchandise inventories of $23.0 million.
Cash used in investing activities was $66.6 million and $40.3 million during fiscal 2003 and fiscal 2002, respectively. During fiscal 2003 and 2002, we had capital
expenditures of $63.0 million and $39.5 million, respectively, to open new stores, remodel existing stores, and invest in distribution and information systems. Our future
capital requirements will depend on the number of new stores we open and the timing of those openings within a given fiscal year. We opened 300 stores in fiscal 2003
and expect to open between 300 and 330 stores in fiscal 2004. Projected capital expenditures for fiscal 2004 are approximately $85 million, to be used primarily to fund
new store openings, acquire a new headquarters and distribution center and invest in distribution and information systems.
The projected capital expenditures for fiscal 2004 of approximately $85 million include approximately $21 million to purchase, improve and equip the 420,000
square foot headquarters and distribution center
27