GameStop 2003 Annual Report Download - page 54
Download and view the complete annual report
Please find page 54 of the 2003 GameStop annual report below. You can navigate through the pages in the report by either clicking on the pages listed below, or by using the keyword search tool below to find specific information within the annual report.-
 1
1 -
2
-
3
-
4
-
5
-
6
-
7
-
8
-
9
-
10
-
11
-
12
-
13
-
14
-
15
-
16
-
17
-
18
-
19
-
20
-
21
-
22
-
23
-
24
-
25
-
26
-
27
-
28
-
29
-
30
-
31
-
32
-
33
-
34
-
35
-
36
-
37
-
38
-
39
-
40
-
41
-
42
-
43
-
 44
44 -
 45
45 -
 46
46 -
 47
47 -
 48
48 -
 49
49 -
 50
50 -
 51
51 -
 52
52 -
 53
53 -
 54
54 -
 55
55 -
 56
56 -
 57
57 -
 58
58 -
 59
59 -
 60
60 -
 61
61 -
 62
62 -
 63
63 -
 64
64 -
65
-
66
-
67
-
68
-
69
-
70
-
71
-
72
-
73
-
74
-
75
-
76
-
77
-
78
-
79
-
80
 |
 |

Table of Contents
GAMESTOP CORP.
NOTES TO CONSOLIDATED FINANCIAL STATEMENTS — (Continued)
products, in which case the cash consideration should be characterized as a reduction of that cost when recognized in the reseller’s income statement. Issue 2 states that
vendor rebates should be recognized on a systematic and rational allocation of the cash consideration offered to each of the underlying transactions that results in
progress by the reseller toward earning the rebate, provided the amounts are probable and reasonably estimable. Issue 1 is effective prospectively for all new
arrangements, including modifications of existing arrangements, entered into after December 31, 2002. Issue 2 is effective prospectively for all new arrangements
initiated after November 21, 2002.
The Company and its vendors participate in cooperative advertising programs and other vendor marketing programs in which the vendors provide the Company
with cash consideration in exchange for marketing and advertising the vendors’ products. The change of our accounting for cooperative advertising arrangements and
other vendor marketing programs resulted in a portion of the consideration received from our vendors reducing the product costs in inventory rather than as an offset to
our marketing and advertising costs as in prior years. The consideration serving as a reduction in inventory will be recognized in cost of sales as inventory is sold. The
amount of vendor allowances to be recorded as a reduction of inventory was determined by calculating the ratio of vendor allowances in excess of specific, incremental
and identifiable advertising and promotional costs to merchandise purchases. The Company then applied this ratio to the value of inventory in determining the amount
of vendor reimbursements to be recorded as a reduction to inventory reflected on the balance sheet.
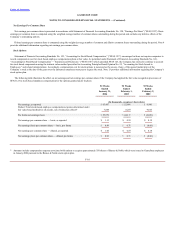
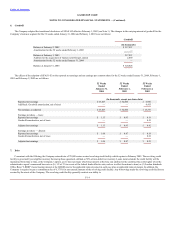
The impact of the new accounting method decreased our cost of sales for the 52 weeks ended January 31, 2004 by $21,569 and increased selling, general and
administrative expenses by $26,779. The impact to cost of sales reflects the reclassification of the cooperative advertising credit, as well as $5,210 deferred as a
reduction in inventory. Prior periods have not been restated. However, the following table presents the 52 weeks ended January 31, 2004, February 1, 2003 and
February 2, 2002 on a pro forma basis as if EITF 02-16 had been implemented prior to the beginning of fiscal 2001:
52 Weeks 52 Weeks 52 Weeks
Ended Ended Ended
January 31, February 1, February 2,
2004 2003 2002
(In thousands, except per share data)
Sales $1,578,838 $1,352,791 $1,121,138
Cost of sales 1,138,596 984,530 833,748
Gross profit 440,242 368,261 287,390
Selling, general and administrative expenses 303,243 258,972 223,315
Depreciation and amortization 28,947 22,553 19,172
Amortization of goodwill —
—
11,125
Operating earnings 108,052 86,736 33,778
Interest income (1,467) (1,998) (123)
Interest expense 663 1,368 19,575
Earnings before income tax expense 108,856 87,366 14,326
Income tax expense 43,108 35,160 7,513
Net earnings $ 65,748 $ 52,206 $ 6,813
Net earnings per common share — basic $1.17 $0.93 $0.19
Weighted average shares of common stock — basic 56,330 56,289 36,009
Net earnings per common share — diluted $1.10 $0.86 $0.17
Weighted average shares of common stock — diluted 59,764 60,419 39,397
F-12