Family Dollar 2010 Annual Report Download - page 63
Download and view the complete annual report
Please find page 63 of the 2010 Family Dollar annual report below. You can navigate through the pages in the report by either clicking on the pages listed below, or by using the keyword search tool below to find specific information within the annual report.-
 1
1 -
2
-
3
-
4
-
5
-
6
-
7
-
8
-
9
-
10
-
11
-
12
-
13
-
14
-
15
-
16
-
17
-
18
-
19
-
20
-
21
-
22
-
23
-
24
-
25
-
26
-
27
-
28
-
29
-
30
-
31
-
32
-
33
-
34
-
35
-
36
-
37
-
38
-
39
-
40
-
41
-
42
-
43
-
44
-
45
-
46
-
47
-
48
-
49
-
50
-
51
-
52
-
 53
53 -
 54
54 -
 55
55 -
 56
56 -
 57
57 -
 58
58 -
 59
59 -
 60
60 -
 61
61 -
 62
62 -
 63
63 -
 64
64 -
 65
65 -
 66
66 -
 67
67 -
 68
68 -
 69
69 -
 70
70 -
 71
71 -
 72
72 -
 73
73 -
74
-
75
-
76
 |
 |

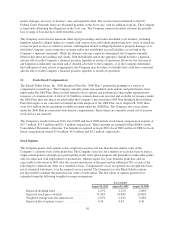
13. Earnings per Share:
Basic net income per common share is computed by dividing net income by the weighted average number of shares
outstanding during each period. Diluted net income per common share gives effect to all securities representing
potential common shares that were dilutive and outstanding during the period. Certain stock options and
performance share rights were excluded from the calculation of diluted net income per common share because their
effects were antidilutive (0.6 million, 1.7 million and 4.2 million shares for fiscal 2010, fiscal 2009 and fiscal 2008,
respectively). In the calculation of diluted net income per common share, the denominator includes the number of
additional common shares that would have been outstanding if the Company’s outstanding dilutive stock options
and performance share rights had been exercised, as determined pursuant to the treasury stock method.
The following table sets forth the computation of basic and diluted net income per common share:
(in thousands, except per share amounts) 2010 2009 2008
Basic Net Income Per Share:
Net income ..................................................... $358,135 $291,266 $233,073
Weighted average number of shares outstanding ........................ 135,745 139,894 140,193
Net income per common share—basic ............................... $ 2.64 $ 2.08 $ 1.66
Diluted Net Income Per share:
Net income ..................................................... $358,135 $291,266 $233,073
Weighted average number of shares outstanding ........................ 135,745 139,894 140,193
Effect of dilutive securities—stock options ............................ 406 262 47
Effect of dilutive securities—performance share rights .................. 445 366 254
Weighted average shares—diluted ................................... 136,596 140,522 140,494
Net income per common share—diluted .............................. $ 2.62 $ 2.07 $ 1.66
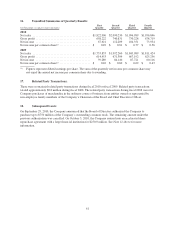
14. Comprehensive Income:
The following table provides a reconciliation of net income to comprehensive income. The unrealized gains and
losses on investment securities are shown net of tax ($1.2 million income tax expense in fiscal 2010, $2.5 million
income tax benefit in fiscal 2009 and $3.0 million income tax benefit in fiscal 2008).
Years Ended
(in thousands) August 28, 2010 August 29, 2009 August 30, 2008
Net income ................................ $358,135 $291,266 $233,073
Other comprehensive income (loss):
Unrealized gains (losses) on investment
securities ........................... 1,914 (4,626) (4,862)
Reclassification adjustment for (gains) losses
realized in net income ................. — 528 —
Comprehensive income ...................... $360,049 $287,168 $228,211
59