Family Dollar 2010 Annual Report Download - page 32
Download and view the complete annual report
Please find page 32 of the 2010 Family Dollar annual report below. You can navigate through the pages in the report by either clicking on the pages listed below, or by using the keyword search tool below to find specific information within the annual report.-
 1
1 -
2
-
3
-
4
-
5
-
6
-
7
-
8
-
9
-
10
-
11
-
12
-
13
-
14
-
15
-
16
-
17
-
18
-
19
-
20
-
21
-
 22
22 -
 23
23 -
 24
24 -
 25
25 -
 26
26 -
 27
27 -
 28
28 -
 29
29 -
 30
30 -
 31
31 -
 32
32 -
 33
33 -
 34
34 -
 35
35 -
 36
36 -
 37
37 -
 38
38 -
 39
39 -
 40
40 -
 41
41 -
 42
42 -
43
-
44
-
45
-
46
-
47
-
48
-
49
-
50
-
51
-
52
-
53
-
54
-
55
-
56
-
57
-
58
-
59
-
60
-
61
-
62
-
63
-
64
-
65
-
66
-
67
-
68
-
69
-
70
-
71
-
72
-
73
-
74
-
75
-
76
 |
 |
In fiscal 2010, we opened 200 stores, closed 70 stores and expanded, relocated, or renovated 117 stores. In
addition, we continued our space re-alignment efforts to accommodate strong customer demand for consumable
merchandise and to improve the in-store shopping experience. These efforts included re-aligning the space in our
stores to support an expanded assortment of key traffic-driving categories, improving merchandise adjacencies
and enhancing merchandise presentations. Approximately 18% of the chain was impacted by these efforts during
fiscal 2010. Since we began these efforts in fiscal 2009, approximately 65% of our stores have completed the
layout changes. We occupy most of our stores under operating leases. Store opening, closing, expansion,
relocation, and renovation plans, as well as overall capital expenditure plans, are continually reviewed and may
change. During fiscal 2011, we plan to open approximately 300 stores and close 80 to 100 stores. In addition, we
plan to renovate 600 to 800 stores at a projected cost of $100,000 to $130,000 per store in connection with a
comprehensive renovation program that will create more customer-focused assortments and layouts, rejuvenated
physical stores and more customer-centric teams.
During fiscal 2010, we purchased 9.4 million shares of our common stock at a cost of $332.2 million.
During fiscal 2009, we purchased 2.3 million shares at a cost of $71.1 million, and during fiscal 2008, we
purchased 3.7 million shares at a cost of $97.7 million. As of August 28, 2010, we had outstanding authorizations
to purchase a total of $129.8 million of our common stock.
On September 29, 2010, subsequent to the end of fiscal 2010, we announced that the Board of Directors
authorized the purchase of up to $750 million of our outstanding common stock. The remaining amount under
the previous authorization was cancelled. On October 5, 2010, we entered into an accelerated share repurchase
agreement with a large financial institution for $250.0 million. See Note 12 to the Consolidated Financial
Statements included in this Report for more information.
The timing and amount of any shares repurchased have been and will continue to be determined by
management based on its evaluation of market conditions and other factors. Our share repurchase program does
not have a stated expiration date, and purchases may be made through open market purchases, private market
transactions or other structured transactions.
Our wholly-owned captive insurance subsidiary maintains certain balances in cash and cash equivalents and
investment securities that are used in connection with our retained workers’ compensation, general liability and
automobile liability risks and are not designated for general corporate purposes. As of the end of fiscal 2010,
these cash and cash equivalents and investment securities balances were $42.1 million and $104.1 million,
respectively.
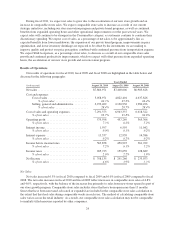
Cash flows from operating activities
Cash provided by operating activities increased $62.3 million during fiscal 2010 as compared to fiscal 2009.
The increase was due primarily to an increase in net income. An increase in our merchandise inventories was
offset by an increase in accounts payable and accrued liabilities and changes in our income tax receivable/
payable amounts, all in the ordinary course of business.
Cash provided by operating activities increased $13.5 million during fiscal 2009 as compared to fiscal 2008.
The increase was due primarily to an increase in net income, partially offset by changes in income tax receivable/
payable amounts. The changes in the income tax receivable/payable amounts were due primarily to a tax refund
received during fiscal 2008 in connection with the formation of our captive insurance subsidiary.
Cash flows from investing activities
During fiscal 2010, we had a cash outflow of $306.9 million compared to a cash outflow of $109.4 million
in fiscal 2009. The increase was due to an increase in purchases of investment securities and an increase in
capital expenditures. We purchased $142.7 million of investment securities during fiscal 2010 compared to no
purchases during fiscal 2009. As the financial markets and global economy begin to stabilize, we are placing
28