Family Dollar 2010 Annual Report Download - page 26
Download and view the complete annual report
Please find page 26 of the 2010 Family Dollar annual report below. You can navigate through the pages in the report by either clicking on the pages listed below, or by using the keyword search tool below to find specific information within the annual report.-
 1
1 -
2
-
3
-
4
-
5
-
6
-
7
-
8
-
9
-
10
-
11
-
12
-
13
-
14
-
15
-
 16
16 -
 17
17 -
 18
18 -
 19
19 -
 20
20 -
 21
21 -
 22
22 -
 23
23 -
 24
24 -
 25
25 -
 26
26 -
 27
27 -
 28
28 -
 29
29 -
 30
30 -
 31
31 -
 32
32 -
 33
33 -
 34
34 -
 35
35 -
 36
36 -
37
-
38
-
39
-
40
-
41
-
42
-
43
-
44
-
45
-
46
-
47
-
48
-
49
-
50
-
51
-
52
-
53
-
54
-
55
-
56
-
57
-
58
-
59
-
60
-
61
-
62
-
63
-
64
-
65
-
66
-
67
-
68
-
69
-
70
-
71
-
72
-
73
-
74
-
75
-
76
 |
 |

ITEM 7. MANAGEMENT’S DISCUSSION AND ANALYSIS OF FINANCIAL CONDITION
AND RESULTS OF OPERATIONS
The following discussion summarizes the significant factors affecting our consolidated results of operations
and financial condition for fiscal 2010, fiscal 2009 and fiscal 2008 and our expectations for fiscal 2011. You
should read this discussion in conjunction with our Consolidated Financial Statements and the Notes to
Consolidated Financial Statements, which are included in this Report. Our discussion contains forward-looking
statements which are based upon our current expectations and which involve risks and uncertainties. Actual
results and the timing of events could differ materially from those anticipated in these forward-looking
statements as a result of a number of factors, including those set forth in the “Cautionary Statement Regarding
Forward-Looking Statements” in the General Information section of this Report and the “Risk Factors” listed in
Part I —Item 1A of this Report.
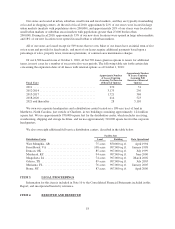
Our fiscal year generally ends on the Saturday closest to August 31 of each year, which generally results in
an extra week every six years. Fiscal 2010, fiscal 2009 and fiscal 2008 were 52-week years.
Executive Overview
We operate a chain of more than 6,800 general merchandise retail discount stores in 44 states, providing
primarily low- and middle-income consumers with a selection of competitively priced merchandise in convenient
neighborhood stores. Our merchandise assortment includes Consumables, Home Products, Apparel and
Accessories, and Seasonal and Electronics. We sell merchandise at prices that generally range from less than $1
to $10.
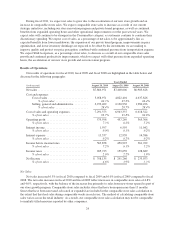
During fiscal 2010 as compared with fiscal 2009, our net sales increased 6.3% to $7.9 billion, our net
income increased 23.0% to $358.1 million, and our diluted net income per common share increased 26.6% to
$2.62. Comparable store sales (stores open more than 13 months) for fiscal 2010 increased 4.8% compared with
fiscal 2009. Our strong performance during fiscal 2010 was due primarily to our strong sales performance and
improvements in cost of sales and selling, general and administrative (“SG&A”) expenses, both as a percentage
of net sales.
Over the past several years, we made investments to improve processes, build merchandising capabilities
and improve the productivity of our workforce. As a result of these investments, we are now building more
compelling merchandise assortments, managing inventories more effectively and executing at the store level
more consistently. These investments have also allowed us to shift our focus to driving stronger revenue growth.
While general economic conditions may be stabilizing, we believe pressures on low- and lower-middle-
income customers continue to be significant. We believe our strategy of providing both value and convenience
positions us well to increase our market share. During fiscal 2010, customer traffic continued to be the primary
driver of our comparable store sales increase, while the dollar value of the average transaction was approximately
flat. Basic consumable needs continue to be the primary driver of recurring shopping trips, but we are also seeing
improvement in certain discretionary categories. For example, during fiscal 2010, we experienced strong sales in
the Seasonal and Electronics category as a result of our increased focus on value, combined with appealing
in-store presentations and customer communications. Sales in the Home Products and the Apparel and
Accessories categories showed improvement over the prior year. The various components affecting our results
for fiscal 2010 are discussed in more detail below.
During fiscal 2010, we focused on four key priorities: increase relevancy to the customer; drive increased
profitability; manage risk; and build great employee teams. The following are some of the highlights from these
efforts.
• We completed the roll-out of new register and point-of-sale technology in all our stores. The new
technology platform facilitates the acceptance of additional payment types, including credit cards and
food stamps, and includes a number of computer-based tools designed to provide our store managers
with better training, analytics and workflow management.
22