Family Dollar 2010 Annual Report Download - page 52
Download and view the complete annual report
Please find page 52 of the 2010 Family Dollar annual report below. You can navigate through the pages in the report by either clicking on the pages listed below, or by using the keyword search tool below to find specific information within the annual report.-
 1
1 -
2
-
3
-
4
-
5
-
6
-
7
-
8
-
9
-
10
-
11
-
12
-
13
-
14
-
15
-
16
-
17
-
18
-
19
-
20
-
21
-
22
-
23
-
24
-
25
-
26
-
27
-
28
-
29
-
30
-
31
-
32
-
33
-
34
-
35
-
36
-
37
-
38
-
39
-
40
-
41
-
 42
42 -
 43
43 -
 44
44 -
 45
45 -
 46
46 -
 47
47 -
 48
48 -
 49
49 -
 50
50 -
 51
51 -
 52
52 -
 53
53 -
 54
54 -
 55
55 -
 56
56 -
 57
57 -
 58
58 -
 59
59 -
 60
60 -
 61
61 -
 62
62 -
63
-
64
-
65
-
66
-
67
-
68
-
69
-
70
-
71
-
72
-
73
-
74
-
75
-
76
 |
 |

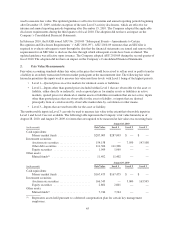
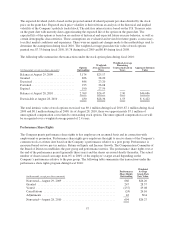
August 29, 2009 Amortized Cost
Gross
Unrealized
Holding
Gains
Gross
Unrealized
Holding
Losses Fair Value
Auction Rate Securities .............................. $181,800 — 15,255(1) $166,545
Equity Securities .................................... 1,979 822 — 2,801
(1) The gross unrealized holding losses for fiscal 2009 were in a continuous unrealized loss position for 12
months or longer.
As noted in Note 2 above, the Company’s auction rate securities are not currently liquid and have contractual
maturities ranging from 15 years to 46 years. The Company’s other debt securities include municipal bonds,
variable-rate demand notes, agency bonds, discount notes, and commercial paper, and have weighted average
maturities of less than one year. While the variable rate demand notes have underlying contractual maturities
beyond one year, the securities are traded in the short-term as a result of 7-day put options.
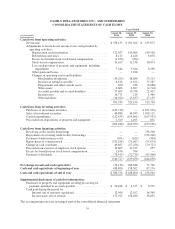
Proceeds from sales of investment securities available-for-sale during fiscal 2010 were $46.9 million compared
to $44.9 million in fiscal 2009 and $1.0 billion in fiscal 2008. The decrease in proceeds from the sale of
investment securities over the past three fiscal years is due primarily to the failure of the auction rate securities
market beginning in fiscal 2008. No material gains or losses were realized on those sales for fiscal 2010, fiscal
2009 and fiscal 2008.
The Company also holds investments in mutual funds in connection with a deferred compensation plan for
certain key management employees. These investments are classified as trading securities and are included, at
fair value, in other assets on the Consolidated Balance Sheet. The Company records an offsetting deferred
compensation liability in accrued liabilities. Changes in the fair value of the investments are reflected in SG&A
on the Consolidated Income Statement as an increase/decrease in deferred compensation expense with an
offsetting increase/decrease in investment income. The fair value of the deferred compensation plan assets was
$11.4 million as of the end of fiscal 2010 and $7.7 million as of the end of fiscal 2009. See Note 9 below for
more information on the deferred compensation plan.
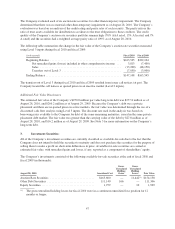
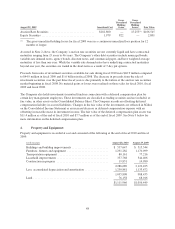
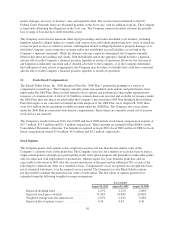
4. Property and Equipment:
Property and equipment is recorded at cost and consisted of the following at the end of fiscal 2010 and fiscal
2009:
(in thousands) August 28, 2010 August 29, 2009
Buildings and building improvements ......................... $ 537,647 $ 515,344
Furniture, fixtures and equipment ............................ 1,291,282 1,170,099
Transportation equipment .................................. 80,161 77,216
Leasehold improvements ................................... 357,768 344,466
Construction in progress ................................... 19,831 14,980
2,286,689 2,122,105
Less: accumulated depreciation and amortization ................ 1,250,881 1,133,672
1,035,808 988,433
Land ................................................... 76,158 68,016
$1,111,966 $1,056,449
48