Family Dollar 2010 Annual Report Download - page 54
Download and view the complete annual report
Please find page 54 of the 2010 Family Dollar annual report below. You can navigate through the pages in the report by either clicking on the pages listed below, or by using the keyword search tool below to find specific information within the annual report.-
 1
1 -
2
-
3
-
4
-
5
-
6
-
7
-
8
-
9
-
10
-
11
-
12
-
13
-
14
-
15
-
16
-
17
-
18
-
19
-
20
-
21
-
22
-
23
-
24
-
25
-
26
-
27
-
28
-
29
-
30
-
31
-
32
-
33
-
34
-
35
-
36
-
37
-
38
-
39
-
40
-
41
-
42
-
43
-
 44
44 -
 45
45 -
 46
46 -
 47
47 -
 48
48 -
 49
49 -
 50
50 -
 51
51 -
 52
52 -
 53
53 -
 54
54 -
 55
55 -
 56
56 -
 57
57 -
 58
58 -
 59
59 -
 60
60 -
 61
61 -
 62
62 -
 63
63 -
 64
64 -
65
-
66
-
67
-
68
-
69
-
70
-
71
-
72
-
73
-
74
-
75
-
76
 |
 |

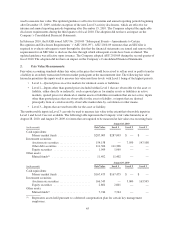
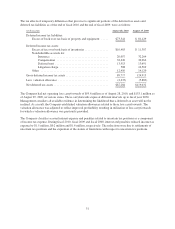
6. Accrued Liabilities:
Accrued liabilities consisted of the following at the end of fiscal 2010 and fiscal 2009:
(in thousands) August 28, 2010 August 29, 2009
Compensation ........................................... $110,932 $110,035
Self-insurance liabilities ................................... 64,004 57,197
Taxes other than income taxes ............................... 88,672 72,067
Deferred rent ............................................ 38,316 37,733
Litigation ............................................... 3,990 53,330
Other(1) ................................................. 53,151 46,153
$359,065 $376,515
(1) Other accrued liabilities consist primarily of store utility accruals, certain store rental accruals, deferred
compensation accruals, and accrued interest.
7. Other Liabilities:
Other liabilities consisted of the following at the end of fiscal 2010 and fiscal 2009:
(in thousands) August 28, 2010 August 29, 2009
Self-insurance liabilities ................................... $185,676 $198,949
Income taxes ............................................ 18,181 37,694
$203,857 $236,643
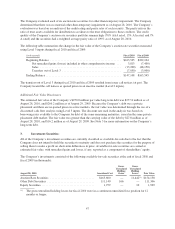
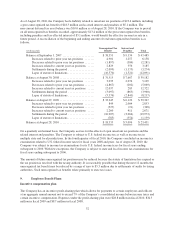
8. Income Taxes:
The provisions for income taxes in fiscal 2010, fiscal 2009 and fiscal 2008 were as follows:
(in thousands) 2010 2009 2008
Current:
Federal ......................................... $174,384 $137,600 $111,723
State ........................................... 23,272 17,633 10,033
197,656 155,233 121,756
Deferred:
Federal ......................................... 8,565 4,971 1,555
State ........................................... (498) (545) 5,378
8,067 4,426 6,933
Total ............................................... $205,723 $159,659 $128,689
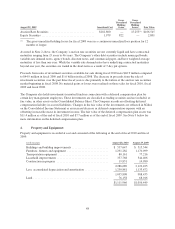
The following table summarizes the components of income tax expense in fiscal 2010, fiscal 2009 and fiscal
2008:
2010 2009 2008
(in thousands)
Income tax
expense
% of pre-tax
income
Income tax
expense
% of pre-tax
income
Income tax
expense
% of pre-tax
income
Computed federal income tax ...... $197,351 35.0% $157,823 35.0% $126,610 35.0%
State income taxes, net of federal
income tax benefit ............. 15,885 2.8 11,599 2.6 7,863 2.2
Valuation allowance ............. (1,286) (0.2) (653) (0.2) 6,350 1.8
Other ......................... (6,227) (1.1) (9,110) (2.0) (12,134) (3.4)
Actual income tax expense ........ $205,723 36.5% $159,659 35.4% $128,689 35.6%
50