Family Dollar 2010 Annual Report Download - page 23
Download and view the complete annual report
Please find page 23 of the 2010 Family Dollar annual report below. You can navigate through the pages in the report by either clicking on the pages listed below, or by using the keyword search tool below to find specific information within the annual report.-
 1
1 -
2
-
3
-
4
-
5
-
6
-
7
-
8
-
9
-
10
-
11
-
12
-
 13
13 -
 14
14 -
 15
15 -
 16
16 -
 17
17 -
 18
18 -
 19
19 -
 20
20 -
 21
21 -
 22
22 -
 23
23 -
 24
24 -
 25
25 -
 26
26 -
 27
27 -
 28
28 -
 29
29 -
 30
30 -
 31
31 -
 32
32 -
 33
33 -
34
-
35
-
36
-
37
-
38
-
39
-
40
-
41
-
42
-
43
-
44
-
45
-
46
-
47
-
48
-
49
-
50
-
51
-
52
-
53
-
54
-
55
-
56
-
57
-
58
-
59
-
60
-
61
-
62
-
63
-
64
-
65
-
66
-
67
-
68
-
69
-
70
-
71
-
72
-
73
-
74
-
75
-
76
 |
 |

PART II
ITEM 5. MARKET FOR REGISTRANT’S COMMON EQUITY, RELATED STOCKHOLDER
MATTERS AND ISSUER PURCHASES OF EQUITY SECURITIES
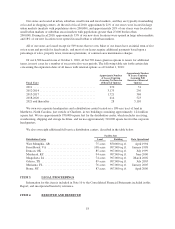
Our common stock is traded on the New York Stock Exchange under the ticker symbol FDO. At October 1,
2010, there were approximately 2,740 holders of record of our common stock. The accompanying tables give the
high and low sales prices of our common stock and the dividends declared per share for each quarter of fiscal
2010 and fiscal 2009. We expect that dividends will continue to be declared quarterly for the foreseeable future.
Market Prices and Dividends
2010 High Low Dividend
First Quarter ......................................................... $31.63 $25.52 $.13 1/2
Second Quarter ....................................................... 33.57 27.15 .15 1/2
Third Quarter ........................................................ 42.07 32.30 .15 1/2
Fourth Quarter ....................................................... 44.03 35.31 .15 1/2
2009 High Low Dividend
First Quarter ......................................................... $32.50 $19.70 $.12 1/2
Second Quarter ....................................................... 29.47 21.79 .13 1/2
Third Quarter ........................................................ 35.00 26.06 .13 1/2
Fourth Quarter ....................................................... 32.97 27.50 .13 1/2
Issuer Purchases of Equity Securities
The following table sets forth information with respect to purchases of shares of our common stock made
during the quarter ended August 28, 2010, by us, on our behalf or by any “affiliated purchaser” as defined by
Rule 10b-18(a)(3) of the Exchange Act.
Period
Total Number
of Shares
Purchased
Average Price
Paid per Share
Total Number of
Shares Purchased as
Part of Publicly
Announced Plans or
Programs(1)
Maximum Number
of Shares that May
Yet Be Purchased
Under the Plans or
Programs(1)(2)
June (5/30/10-7/3/10) .................. 524,100 $38.84 524,100 4,927,181
July (7/4/10-7/31/10) .................. 775,331 38.24 775,331 4,601,880
August (8/1/10-8/28/10) ................ 1,435,136 42.16 1,435,136 2,994,418
Total ........................... 2,734,567 $40.41 2,734,567 2,994,418
(1) On November 18, 2009, we announced that the Board of Directors authorized the purchase of up to $400
million of our outstanding common stock from time to time as market conditions warrant. As of August 28,
2010, there was $129.8 million remaining under this authorization.
(2) Remaining dollar amounts are converted to shares using the closing stock price as of the end of the fiscal
month.
The stock repurchases in the table above include both open market purchases and purchases made in
connection with structured repurchase agreements. See Note 12 to the Consolidated Financial Statements
included in this Report for more information.
On September 29, 2010, subsequent to the end of fiscal 2010, we announced that the Board of Directors
authorized the purchase of up to $750 million of our outstanding common stock. The remaining amount under
the previous authorization was cancelled. On October 5, 2010, we entered into an accelerated share repurchase
agreement with a large financial institution for $250.0 million. See Note 12 to the Consolidated Financial
Statements included in this Report for more information.
19