Family Dollar 2010 Annual Report Download - page 30
Download and view the complete annual report
Please find page 30 of the 2010 Family Dollar annual report below. You can navigate through the pages in the report by either clicking on the pages listed below, or by using the keyword search tool below to find specific information within the annual report.-
 1
1 -
2
-
3
-
4
-
5
-
6
-
7
-
8
-
9
-
10
-
11
-
12
-
13
-
14
-
15
-
16
-
17
-
18
-
19
-
 20
20 -
 21
21 -
 22
22 -
 23
23 -
 24
24 -
 25
25 -
 26
26 -
 27
27 -
 28
28 -
 29
29 -
 30
30 -
 31
31 -
 32
32 -
 33
33 -
 34
34 -
 35
35 -
 36
36 -
 37
37 -
 38
38 -
 39
39 -
 40
40 -
41
-
42
-
43
-
44
-
45
-
46
-
47
-
48
-
49
-
50
-
51
-
52
-
53
-
54
-
55
-
56
-
57
-
58
-
59
-
60
-
61
-
62
-
63
-
64
-
65
-
66
-
67
-
68
-
69
-
70
-
71
-
72
-
73
-
74
-
75
-
76
 |
 |
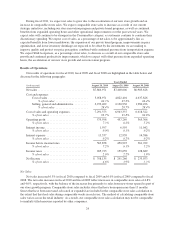
The increase in SG&A expenses, as a percentage of net sales, in fiscal 2009 as compared to fiscal 2008, was
due primarily to higher incentive compensation and higher insurance expense. Most other costs decreased as a
percentage of net sales, including payroll costs and occupancy costs, as a result of a 4.0% increase in comparable
store sales and our continued focus on expense control.
Interest Income
Interest income decreased $5.0 million in fiscal 2010 compared to fiscal 2009 and $4.4 million in fiscal
2009 compared to fiscal 2008. The decreases in both years were due to lower interest rates.
Interest Expense
Interest expense increased $0.4 million in fiscal 2010 compared to fiscal 2009 and decreased $1.6 million in
fiscal 2009 compared to fiscal 2008. The increase in fiscal 2010 was due to lower capitalized interest. We did not
borrow under our credit facilities during fiscal 2010 or fiscal 2009. During fiscal 2008, we incurred $1.7 million
in interest expense related to credit facility borrowings.
Income Taxes
The effective tax rate was 36.5% for fiscal 2010, 35.4% in fiscal 2009 and 35.6% in fiscal 2008. The
increase in the effective tax rate in fiscal 2010 as compared to fiscal 2009 was due primarily to a decrease in
federal jobs tax credits, changes in state income taxes, and lower tax-exempt interest income, offset partially by a
decrease in our liabilities for uncertain tax positions. The decrease in the effective rate in fiscal 2009 compared to
fiscal 2008 was due primarily to an increase in certain federal jobs tax credits and changes in state income tax,
offset partially by changes in our liabilities for uncertain tax positions and a decrease in tax-exempt interest
income.
Liquidity and Capital Resources
General
We have consistently maintained a strong liquidity position. Cash provided by operating activities during
fiscal 2010 was $591.5 million compared to $529.2 million in fiscal 2009 and $515.7 million in fiscal 2008. Our
operating cash flows are generally sufficient to fund our regular operating needs, capital expenditure program,
cash dividend payments, interest payments, and share repurchases. We believe operating cash flows and existing
credit facilities will provide sufficient liquidity for our ongoing operations and growth initiatives. We plan to
fund future share repurchases through a combination of cash on hand, cash from operations, and potential debt
financings.
Credit Facilities
On December 16, 2009, we entered into an unsecured revolving credit facility with a syndicate of lenders
for short-term borrowings of up to $250 million. The credit facility has an initial term of 364 days and provides
for two one-year extensions that require lender consent. Any borrowings under the credit facility accrue interest
at a variable rate based on short-term market interest rates. The credit facility replaced our previous $250 million
364-day credit facility.
We also maintain a $350 million unsecured revolving credit facility that matures on August 24, 2011. Any
borrowings under this credit facility also accrue interest at a variable rate based on short-term market interest
rates. Outstanding standby letters of credit ($153.9 million as of August 28, 2010) reduce the amount available
for borrowing under the $350 million credit facility.
There were no borrowings under the credit facilities during fiscal 2010. The credit facilities contain certain
restrictive financial covenants, which include a consolidated debt to consolidated capitalization ratio, a fixed
charge coverage ratio, and a priority debt to consolidated net worth ratio. As of August 28, 2010, we were in
compliance with all such covenants.
26