Family Dollar 2010 Annual Report Download - page 45
Download and view the complete annual report
Please find page 45 of the 2010 Family Dollar annual report below. You can navigate through the pages in the report by either clicking on the pages listed below, or by using the keyword search tool below to find specific information within the annual report.-
 1
1 -
2
-
3
-
4
-
5
-
6
-
7
-
8
-
9
-
10
-
11
-
12
-
13
-
14
-
15
-
16
-
17
-
18
-
19
-
20
-
21
-
22
-
23
-
24
-
25
-
26
-
27
-
28
-
29
-
30
-
31
-
32
-
33
-
34
-
 35
35 -
 36
36 -
 37
37 -
 38
38 -
 39
39 -
 40
40 -
 41
41 -
 42
42 -
 43
43 -
 44
44 -
 45
45 -
 46
46 -
 47
47 -
 48
48 -
 49
49 -
 50
50 -
 51
51 -
 52
52 -
 53
53 -
 54
54 -
 55
55 -
56
-
57
-
58
-
59
-
60
-
61
-
62
-
63
-
64
-
65
-
66
-
67
-
68
-
69
-
70
-
71
-
72
-
73
-
74
-
75
-
76
 |
 |

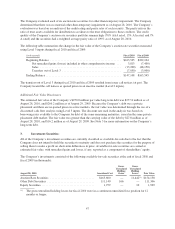
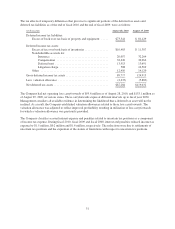
and $34.7 million non-current) as of the end of fiscal 2010 and $45.5 million ($4.0 million current and $41.5 million
non-current) as of the end of fiscal 2009. The current portion of the assets is included in prepayments and other
current assets on the Consolidated Balance Sheets, and the non-current portion is included in other assets.
In addition to the adjustments noted above, certain prior year amounts have been reclassified to conform to the
current year presentation. The Company’s long-term income tax liabilities related to uncertain tax positions, which
were previously broken out as a separate line on the Consolidated Balance Sheets, have been reclassified and
included in other liabilities.
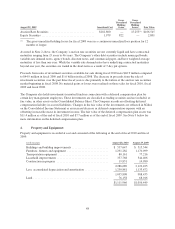
The adjustments and reclassifications to the Consolidated Balance Sheet as of the end of fiscal 2009 are
summarized in the table below.
(in thousands)
As Reported
August 29, 2009
Adjustments and
Reclassifications
Revised
August 29, 2009
Assets
Deferred income taxes ...................... $ 93,164 $ (10,457) $ 82,707
Prepayments and other current assets ........... $ 59,168 $ 4,037 $ 63,205
Total current assets ......................... $1,599,438 $ (6,420) $1,593,018
Other assets ............................... $ 23,290 $ 41,500 $ 64,790
Total assets .............................. $2,842,722 $ 35,080 $2,877,802
Liabilities
Accrued liabilities ......................... $ 529,927 $(153,412) $ 376,515
Total current liabilities ...................... $1,059,707 $(153,412) $ 906,295
Other liabilities ............................ $ — $236,643 $ 236,643
Deferred income taxes ...................... $ 55,261 $ (10,457) $ 44,804
Income taxes .............................. $ 37,694 $ (37,694) $ —
Total liabilities ........................... $1,402,662 $ 35,080 $1,437,742
Cash equivalents
The Company considers all highly liquid investments with an original maturity of three months or less to be cash
equivalents. The carrying amount of the Company’s cash equivalents approximates fair value due to the short
maturities of these investments and consists primarily of money market funds and other overnight
investments. The Company maintains cash deposits with major banks, which from time to time may exceed
federally insured limits. The Company periodically assesses the financial condition of the institutions and
believes that the risk of any loss is minimal. Payments due from banks for third-party credit card, debit card and
electronic benefit transactions are generally processed within 24-72 hours and are classified as cash equivalents.
The Company maintains zero balance cash disbursement accounts with certain banks. Outstanding checks in
excess of funds on deposit with respect to these banks, referred to as cash overdrafts, are classified as accounts
payable on the Consolidated Balance Sheets, and totaled $49.7 million at the end of fiscal 2010. There were no
cash overdrafts at the end of fiscal 2009. Changes in these overdraft amounts are recorded as financing activities
on the Consolidated Statements of Cash Flows.
The Company’s wholly-owned captive insurance subsidiary maintains balances in cash and cash equivalents that
are used in connection with the Company’s retained workers’ compensation, general liability and automobile
liability risks and are not designated for general corporate purposes. These cash and cash equivalents balances
totaled $42.1 million as of the end of fiscal 2010 and $58.6 million as of the end of fiscal 2009.
Investment securities
The Company classifies all investment securities as available-for-sale. Securities accounted for as
available-for-sale are required to be reported at fair value with unrealized gains and losses, net of taxes, excluded
41