Family Dollar 2010 Annual Report Download - page 51
Download and view the complete annual report
Please find page 51 of the 2010 Family Dollar annual report below. You can navigate through the pages in the report by either clicking on the pages listed below, or by using the keyword search tool below to find specific information within the annual report.-
 1
1 -
2
-
3
-
4
-
5
-
6
-
7
-
8
-
9
-
10
-
11
-
12
-
13
-
14
-
15
-
16
-
17
-
18
-
19
-
20
-
21
-
22
-
23
-
24
-
25
-
26
-
27
-
28
-
29
-
30
-
31
-
32
-
33
-
34
-
35
-
36
-
37
-
38
-
39
-
40
-
 41
41 -
 42
42 -
 43
43 -
 44
44 -
 45
45 -
 46
46 -
 47
47 -
 48
48 -
 49
49 -
 50
50 -
 51
51 -
 52
52 -
 53
53 -
 54
54 -
 55
55 -
 56
56 -
 57
57 -
 58
58 -
 59
59 -
 60
60 -
 61
61 -
62
-
63
-
64
-
65
-
66
-
67
-
68
-
69
-
70
-
71
-
72
-
73
-
74
-
75
-
76
 |
 |

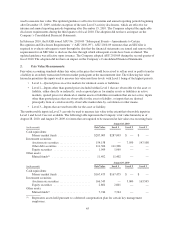
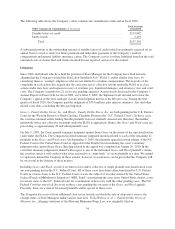
The Company evaluated each of its auction rate securities for other-than-temporary impairment. The Company
determined that there was no material other-than-temporary impairment as of August 28, 2010. The Company’s
evaluation was based on an analysis of the credit rating and parity ratio of each security. The parity ratio is the
ratio of trust assets available for distribution to creditors to the trust obligations to those creditors. The credit
quality of the Company’s auction rate securities portfolio remains high (78% AAA rated, 15% AA rated, and 7%
A rated) and the securities had a weighted average parity ratio of 109% as of August 28, 2010.
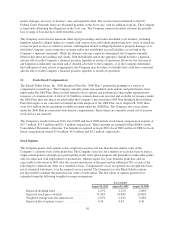
The following table summarizes the change in the fair value of the Company’s auction rate securities measured
using Level 3 inputs during fiscal 2010 and fiscal 2009:
(in thousands) Fiscal 2010 Fiscal 2009
Beginning Balance ................................................ $163,545 $222,104
Net unrealized gains (losses) included in other comprehensive income . . . 3,813 (7,409)
Sales ....................................................... (13,200) (48,150)
Transfers out of Level 3 ........................................ (7,050) (3,000)
Ending Balance ................................................... $147,108 $163,545
The transfers out of Level 3 during fiscal 2010 and fiscal 2009 resulted from issuer call notices (at par). The
Company treated the call notices as quoted prices in an inactive market (Level 2 inputs).
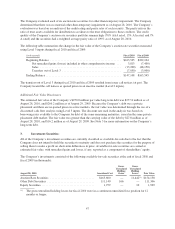
Additional Fair Value Disclosures
The estimated fair value of the Company’s $250.0 million par value long-term debt was $277.8 million as of
August 28, 2010, and $266.2 million as of August 29, 2009. Because the Company’s debt was a private
placement and there are no quoted prices in active markets, the fair value was determined through the use of a
discounted cash flow analysis using Level 3 inputs. The discount rate used in the analysis was based on
borrowing rates available to the Company for debt of the same remaining maturities, issued in the same private
placement debt market. The fair value was greater than the carrying value of the debt by $27.8 million as of
August 28, 2010, and $16.2 million as of August 29, 2009. See Note 5 for more information on the Company’s
long-term debt.
3. Investment Securities:
All of the Company’s investment securities are currently classified as available-for-sale due to the fact that the
Company does not intend to hold the securities to maturity and does not purchase the securities for the purpose of
selling them to make a profit on short-term differences in price. Available-for-sale securities are carried at
estimated fair value, with unrealized gains and losses, if any, reported as a component of shareholders’ equity.
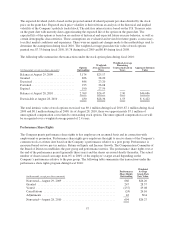
The Company’s investments consisted of the following available-for-sale securities at the end of fiscal 2010 and
fiscal 2009 (in thousands):
August 28, 2010 Amortized Cost
Gross
Unrealized
Holding
Gains
Gross
Unrealized
Holding
Losses Fair Value
Auction Rate Securities .............................. $165,600 — 11,442(1) $154,158
Other Debt Securities ................................ 111,140 166 — 111,306
Equity Securities .................................... 1,979 — 10 1,969
(1) The gross unrealized holding losses for fiscal 2010 were in a continuous unrealized loss position for 12
months or longer.
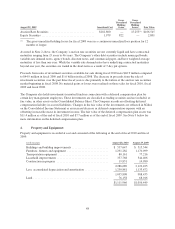
47