Family Dollar 2010 Annual Report Download - page 61
Download and view the complete annual report
Please find page 61 of the 2010 Family Dollar annual report below. You can navigate through the pages in the report by either clicking on the pages listed below, or by using the keyword search tool below to find specific information within the annual report.-
 1
1 -
2
-
3
-
4
-
5
-
6
-
7
-
8
-
9
-
10
-
11
-
12
-
13
-
14
-
15
-
16
-
17
-
18
-
19
-
20
-
21
-
22
-
23
-
24
-
25
-
26
-
27
-
28
-
29
-
30
-
31
-
32
-
33
-
34
-
35
-
36
-
37
-
38
-
39
-
40
-
41
-
42
-
43
-
44
-
45
-
46
-
47
-
48
-
49
-
50
-
 51
51 -
 52
52 -
 53
53 -
 54
54 -
 55
55 -
 56
56 -
 57
57 -
 58
58 -
 59
59 -
 60
60 -
 61
61 -
 62
62 -
 63
63 -
 64
64 -
 65
65 -
 66
66 -
 67
67 -
 68
68 -
 69
69 -
 70
70 -
 71
71 -
72
-
73
-
74
-
75
-
76
 |
 |

The expected dividend yield is based on the projected annual dividend payment per share divided by the stock
price on the grant date. Expected stock price volatility is derived from an analysis of the historical and implied
volatility of the Company’s publicly traded stock. The risk-free interest rate is based on the U.S. Treasury rates
on the grant date with maturity dates approximating the expected life of the option on the grant date. The
expected life of the options is based on an analysis of historical and expected future exercise behavior, as well as
certain demographic characteristics. These assumptions are evaluated and revised for future grants, as necessary,
to reflect market conditions and experience. There were no significant changes made to the methodology used to
determine the assumptions during fiscal 2010. The weighted-average grant-date fair value of stock options
granted was $7.33 during fiscal 2010, $5.78 during fiscal 2009 and $6.89 during fiscal 2008.
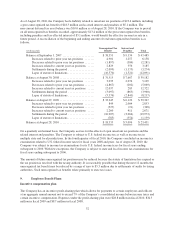
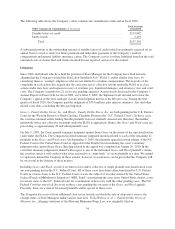
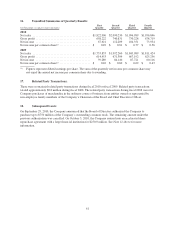
The following table summarizes the transactions under the stock option plans during fiscal 2010:
(in thousands, except per share amounts)
Options
Outstanding
Weighted-
Average Exercise
Price
Weighted-Average
Remaining
Contractual Life in
Years
Aggregate Intrinsic
Value
Balance at August 29, 2009 .............. 3,174 $25.17
Granted ............................. 826 28.20
Exercised ............................ 846 23.20
Forfeited ............................. 195 26.08
Expired .............................. 190 27.59
Balance at August 28, 2010 .............. 2,769 $26.47 2.90 $46,686
Exercisable at August 28, 2010 ........... 430 $28.36 1.53 $ 6,422
The total intrinsic value of stock options exercised was $9.1 million during fiscal 2010, $7.1 million during fiscal
2009 and $0.1 million during fiscal 2008. As of August 28, 2010, there was approximately $7.1 million of
unrecognized compensation cost related to outstanding stock options. The unrecognized compensation cost will
be recognized over a weighted-average period of 2.4 years.
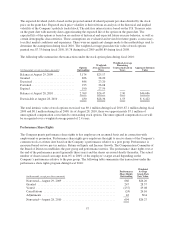
Performance Share Rights
The Company grants performance share rights to key employees on an annual basis and in connection with
employment or promotion. Performance share rights give employees the right to receive shares of the Company’s
common stock at a future date based on the Company’s performance relative to a peer group. Performance is
measured based on two pre-tax metrics: Return on Equity and Income Growth. The Compensation Committee of
the Board of Directors establishes the peer group and performance metrics. The performance share rights vest at
the end of the performance period (generally three years) and the shares are issued shortly thereafter. The actual
number of shares issued can range from 0% to 200% of the employee’s target award depending on the
Company’s performance relative to the peer group. The following table summarizes the transactions under the
performance share rights program during fiscal 2010:
(in thousands, except per share amounts)
Performance
Share Rights
Outstanding
Weighted
Average
Grant-Date
Fair Value
Nonvested—August 29, 2009 .................................... 666 $26.20
Granted ..................................................... 247 28.37
Vested ...................................................... (237) 29.08
Cancellations ................................................. (24) 26.16
Adjustments .................................................. 42 N/A
Nonvested—August 28, 2010 .................................... 694 $26.27
57