Family Dollar 2010 Annual Report Download - page 33
Download and view the complete annual report
Please find page 33 of the 2010 Family Dollar annual report below. You can navigate through the pages in the report by either clicking on the pages listed below, or by using the keyword search tool below to find specific information within the annual report.-
 1
1 -
2
-
3
-
4
-
5
-
6
-
7
-
8
-
9
-
10
-
11
-
12
-
13
-
14
-
15
-
16
-
17
-
18
-
19
-
20
-
21
-
22
-
 23
23 -
 24
24 -
 25
25 -
 26
26 -
 27
27 -
 28
28 -
 29
29 -
 30
30 -
 31
31 -
 32
32 -
 33
33 -
 34
34 -
 35
35 -
 36
36 -
 37
37 -
 38
38 -
 39
39 -
 40
40 -
 41
41 -
 42
42 -
 43
43 -
44
-
45
-
46
-
47
-
48
-
49
-
50
-
51
-
52
-
53
-
54
-
55
-
56
-
57
-
58
-
59
-
60
-
61
-
62
-
63
-
64
-
65
-
66
-
67
-
68
-
69
-
70
-
71
-
72
-
73
-
74
-
75
-
76
 |
 |

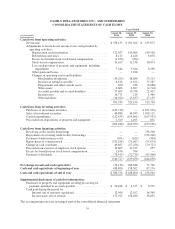
more of our available cash in short-term investment securities. Our long-term investment securities consist of
auction rate securities that are not currently liquid. See Note 2 to the Consolidated Financial Statements included
in this Report for more information.
During fiscal 2009, we had a cash outflow of $109.4 million compared to a cash outflow of $199.6 million
in fiscal 2008. The decrease was due primarily to changes in the purchase/sale of investment securities. Due to
volatility in the financial markets and the liquidity issues surrounding our auction rate securities, we did not
purchase any investment securities during fiscal 2009 and only liquidated $44.9 million of investment securities.
During fiscal 2008, we had a net cash outflow of $32.5 million related to investment securities.
Cash flows from financing activities
During fiscal 2010, we had a cash outflow of $340.7 million compared to a cash outflow of $139.5 million
during fiscal 2009. The increase was due primarily to an increase in repurchases of common stock, offset
partially by changes in cash overdrafts. We paid $332.2 million for purchases of our common stock during fiscal
2010 compared to $71.1 million in fiscal 2009. Cash overdrafts increased $49.7 million during fiscal 2010
compared with a $27.3 million decrease in fiscal 2009. See Note 1 to the Consolidated Financial Statements
included in this Report for an explanation of our cash overdrafts.
During fiscal 2009, we had a cash outflow of $139.5 million compared to a cash outflow of $244.9 million
during fiscal 2008. The decrease was due primarily to changes in cash overdrafts, an increase in proceeds from
the exercise of stock options, and a decrease in purchases of our common stock. Cash overdrafts decreased $27.3
million in fiscal 2009 compared to fiscal 2008 and $79.7 million in fiscal 2008 compared to fiscal 2007. Proceeds
from the exercise of stock options increased $31.3 million in fiscal 2009 as compared to fiscal 2008. Purchases of
our common stock decreased $26.6 million in fiscal 2009 compared to fiscal 2008.
Contractual Obligations and Other Commercial Commitments
The following table shows our obligations and commitments to make future payments under contractual
obligations at the end of fiscal 2010:
Payments Due During the Period Ending
(in thousands)
Contractual Obligations Total
August
2011
August
2012
August
2013
August
2014
August
2015 Thereafter
Long-term debt .............. $ 250,000 $ — $ 16,200 $ 16,200 $ 16,200 $ 16,200 $185,200
Interest ..................... 65,141 13,387 12,609 11,760 10,911 10,063 6,411
Merchandise letters of credit .... 217,417 217,417 — ————
Operating leases ............. 1,490,872 345,997 307,881 257,971 204,189 144,176 230,658
Construction obligations ....... 15,335 15,335 — ————
Minimum royalties(1) .......... 11,600 2,550 2,750 2,800 2,800 700 —
Total ...................... $2,050,365 $594,686 $339,440 $288,731 $234,100 $171,139 $422,269
(1) Minimum royalty payments related to an exclusive agreement to sell certain branded merchandise.
At the end of fiscal 2010, approximately $79.3 million of the merchandise letters of credit were included in
accounts payable and accrued liabilities on our Consolidated Balance Sheet. Most of our operating leases provide
us with an option to extend the term of the lease at designated rates. See Part I—Item 2— “Properties” in this
Report.
As of August 28, 2010, we had $23.4 million in liabilities related to our uncertain tax positions. At this time,
we cannot reasonably determine the timing of any payments related to these liabilities, except for $5.2 million,
which were classified as current liabilities and may become payable within the next 12 months. See Note 8 to the
Consolidated Financial Statements included in this Report for more information on our tax liabilities.
29