Family Dollar 2010 Annual Report Download - page 28
Download and view the complete annual report
Please find page 28 of the 2010 Family Dollar annual report below. You can navigate through the pages in the report by either clicking on the pages listed below, or by using the keyword search tool below to find specific information within the annual report.-
 1
1 -
2
-
3
-
4
-
5
-
6
-
7
-
8
-
9
-
10
-
11
-
12
-
13
-
14
-
15
-
16
-
17
-
 18
18 -
 19
19 -
 20
20 -
 21
21 -
 22
22 -
 23
23 -
 24
24 -
 25
25 -
 26
26 -
 27
27 -
 28
28 -
 29
29 -
 30
30 -
 31
31 -
 32
32 -
 33
33 -
 34
34 -
 35
35 -
 36
36 -
 37
37 -
 38
38 -
39
-
40
-
41
-
42
-
43
-
44
-
45
-
46
-
47
-
48
-
49
-
50
-
51
-
52
-
53
-
54
-
55
-
56
-
57
-
58
-
59
-
60
-
61
-
62
-
63
-
64
-
65
-
66
-
67
-
68
-
69
-
70
-
71
-
72
-
73
-
74
-
75
-
76
 |
 |

During fiscal 2011, we expect net sales to grow due to the acceleration of our new store growth and an
increase in comparable stores sales. We expect comparable store sales to increase as a result of our current
strategic initiatives, including our store renovation program and private brand programs, as well as continued
benefits from expanded operating hours and other operational improvements over the past several years. We
expect sales will continue to be strongest in the Consumables category, as customers continue to constrain their
discretionary spending. We expect cost of sales, as a percentage of net sales, to be approximately flat, as
expected benefits from lower markdowns, the expansion of our private brand program, improvements in price
optimization, and lower inventory shrinkage are expected to be offset by the investments we are making to
improve quality and protect our price perception, combined with continued pressure from transportation expense.
We expect SG&A expenses, as a percentage of net sales, to decrease as a result of our comparable store sales
growth and continued productivity improvements, which we expect will offset pressure from expanded operating
hours, the acceleration of our new store growth and our renovation program.
Results of Operations
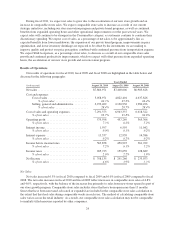
Our results of operations for fiscal 2010, fiscal 2009 and fiscal 2008 are highlighted in the table below and
discussed in the following paragraphs:
Years Ended
(in thousands) August 28, 2010 August 29, 2009 August 30, 2008
Net sales .................................. $7,866,971 $7,400,606 $6,983,628
Cost and expenses:
Cost of sales ........................... 5,058,971 4,822,401 4,637,826
% of net sales ...................... 64.3% 65.2% 66.4%
Selling, general and administrative ......... 2,232,402 2,120,936 1,980,496
% of net sales ...................... 28.4% 28.7% 28.4%
Cost of sales and operating expenses ............ 7,291,373 6,943,337 6,618,322
% of net sales .......................... 92.7% 93.8% 94.8%
Operating profit ............................ 575,598 457,269 365,306
% of net sales .......................... 7.3% 6.2% 5.2%
Interest income ............................. 1,597 6,595 11,042
% of net sales .......................... 0.0% 0.1% 0.2%
Interest expense ............................ 13,337 12,939 14,586
% of net sales .......................... 0.2% 0.2% 0.2%
Income before income taxes .................. 563,858 450,925 361,762
% of net sales .......................... 7.2% 6.1% 5.2%
Income taxes .............................. 205,723 159,659 128,689
% of net sales .......................... 2.6% 2.2% 1.8%
Net Income ................................ $ 358,135 $ 291,266 $ 233,073
% of net sales .......................... 4.6% 3.9% 3.3%
Net Sales
Net sales increased 6.3% in fiscal 2010 compared to fiscal 2009 and 6.0% in fiscal 2009 compared to fiscal
2008. The net sales increases in fiscal 2010 and fiscal 2009 reflect increases in comparable store sales of 4.8%
and 4.0%, respectively, with the balance of the increases due primarily to sales from new stores opened as part of
our store growth program. Comparable store sales includes stores that have been open more than 13 months.
Stores that have been renovated, relocated or expanded are included in the comparable store sales calculation to
the extent that they had sales during comparable weeks in each year. The method of calculating comparable store
sales varies across the retail industry. As a result, our comparable store sales calculation may not be comparable
to similarly titled measures reported by other companies.
24