Family Dollar 2010 Annual Report Download - page 29
Download and view the complete annual report
Please find page 29 of the 2010 Family Dollar annual report below. You can navigate through the pages in the report by either clicking on the pages listed below, or by using the keyword search tool below to find specific information within the annual report.-
 1
1 -
2
-
3
-
4
-
5
-
6
-
7
-
8
-
9
-
10
-
11
-
12
-
13
-
14
-
15
-
16
-
17
-
18
-
 19
19 -
 20
20 -
 21
21 -
 22
22 -
 23
23 -
 24
24 -
 25
25 -
 26
26 -
 27
27 -
 28
28 -
 29
29 -
 30
30 -
 31
31 -
 32
32 -
 33
33 -
 34
34 -
 35
35 -
 36
36 -
 37
37 -
 38
38 -
 39
39 -
40
-
41
-
42
-
43
-
44
-
45
-
46
-
47
-
48
-
49
-
50
-
51
-
52
-
53
-
54
-
55
-
56
-
57
-
58
-
59
-
60
-
61
-
62
-
63
-
64
-
65
-
66
-
67
-
68
-
69
-
70
-
71
-
72
-
73
-
74
-
75
-
76
 |
 |
The 4.8% increase in comparable store sales in fiscal 2010 resulted primarily from an increase in customer
traffic, as measured by the number of register transactions in comparable stores. During fiscal 2010, the customer
count increased approximately 4.3% and the average customer transaction increased approximately 0.5% to
$9.91 compared to fiscal 2009. Sales during fiscal 2010, on a comparable store basis, were strongest in the
Consumables and the Seasonal and Electronics categories.
The 4.0% increase in comparable store sales in fiscal 2009 resulted from an increase in customer traffic, as
measured by the number of register transactions in comparable stores and an increase in the dollar value of the
average customer transaction. During fiscal 2009, the customer count increased approximately 2.8% and the
average customer transaction increased approximately 1.2% to $9.84 compared to fiscal 2008. Sales during fiscal
2009, on a comparable store basis, were strongest in the Consumables category. Sales in more discretionary
categories were soft.
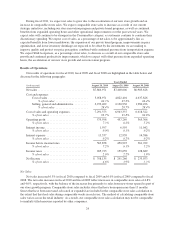
During fiscal 2010, we opened 200 stores and closed 70 stores for a net addition of 130 stores, compared
with the opening of 180 stores and closing of 96 stores for a net addition of 84 stores during fiscal 2009, and the
opening of 205 stores and closing of 64 stores for a net addition of 141 stores during fiscal 2008.
Cost of Sales
Cost of sales increased 4.9% in fiscal 2010 compared to fiscal 2009 and 4.0% in fiscal 2009 compared to
fiscal 2008. These increases were due primarily to additional sales volume. Cost of sales, as a percentage of net
sales, was 64.3% in fiscal 2010, 65.2% in fiscal 2009 and 66.4% in fiscal 2008. The decrease in cost of sales, as a
percentage of net sales, during fiscal 2010 as compared to fiscal 2009, was due primarily to lower inventory
shrinkage, higher purchase mark-ups, lower freight expense, and lower markdown expense, which more than
offset increased sales of lower-margin consumable merchandise. We believe that inventory shrinkage benefited
from higher store manager retention, lower levels of discretionary merchandise and improved analytics and
monitoring processes. We continue to focus on improving our purchase mark-ups through our price management
work, the continued development of our private brand offering, and our global sourcing efforts. Freight expense
benefited from improvements in inventory productivity, the impact of lower diesel costs on the first half of fiscal
2010, and increased transportation productivity and efficiency. Markdown expense benefited from strong sales of
seasonal merchandise, our continued focus on improving inventory productivity and managing inventory risk,
and the absence of any markdown expense during fiscal 2010 for products containing lead/phthalates. We
incurred approximately $6.8 million of lead/phthalate markdown expense during fiscal 2009 in connection with
new product safety legislation.
The decrease in cost of sales, as a percentage of net sales, during fiscal 2009 as compared to fiscal 2008,
was due primarily to lower freight expense, lower inventory shrinkage, and lower seasonal markdowns. In
addition, higher purchase mark-ups more than offset the effect of stronger sales of lower-margin consumable
merchandise.
Selling, General and Administrative Expenses
SG&A expenses increased 5.3% in fiscal 2010 compared to fiscal 2009 and 7.1% in fiscal 2009 compared to
fiscal 2008. The increases in these expenses were due in part to additional sales volume and additional costs
arising from the continued growth in the number of stores in operation. SG&A expenses, as a percentage of net
sales, were 28.4% in fiscal 2010, 28.7% in fiscal 2009 and 28.4% in fiscal 2008. Most costs in fiscal 2010,
including occupancy costs, were leveraged as a result of a 4.8% increase in comparable store sales and continued
productivity improvements. As a percentage of net sales, decreases in insurance expense (approximately 0.2% of
net sales) and utility expense (approximately 0.2% of net sales) more than offset an increase in store payroll
expense (approximately 0.3% of net sales). Insurance expense continues to benefit from favorable trends in
workers’ compensation and general liability costs, and our energy management efforts contributed to the
decrease in utility expense. The increase in store payroll expense was due primarily to the expansion of our store
operating hours.
25