Family Dollar 2010 Annual Report Download - page 44
Download and view the complete annual report
Please find page 44 of the 2010 Family Dollar annual report below. You can navigate through the pages in the report by either clicking on the pages listed below, or by using the keyword search tool below to find specific information within the annual report.-
 1
1 -
2
-
3
-
4
-
5
-
6
-
7
-
8
-
9
-
10
-
11
-
12
-
13
-
14
-
15
-
16
-
17
-
18
-
19
-
20
-
21
-
22
-
23
-
24
-
25
-
26
-
27
-
28
-
29
-
30
-
31
-
32
-
33
-
 34
34 -
 35
35 -
 36
36 -
 37
37 -
 38
38 -
 39
39 -
 40
40 -
 41
41 -
 42
42 -
 43
43 -
 44
44 -
 45
45 -
 46
46 -
 47
47 -
 48
48 -
 49
49 -
 50
50 -
 51
51 -
 52
52 -
 53
53 -
 54
54 -
55
-
56
-
57
-
58
-
59
-
60
-
61
-
62
-
63
-
64
-
65
-
66
-
67
-
68
-
69
-
70
-
71
-
72
-
73
-
74
-
75
-
76
 |
 |
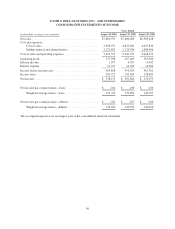
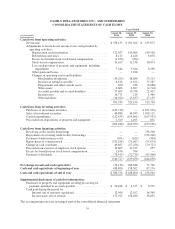
FAMILY DOLLAR STORES, INC., AND SUBSIDIARIES
NOTES TO CONSOLIDATED FINANCIAL STATEMENTS
1. Description of Business and Summary of Significant Accounting Policies:
Description of business
The Company operates a chain of more than 6,800 general merchandise retail discount stores in 44 contiguous
states, providing low- and middle-income consumers with a selection of competitively priced merchandise in
convenient neighborhood stores. The Company’s products include health and beauty aids, packaged food and
refrigerated products, home cleaning supplies, housewares, stationery, seasonal goods, apparel and domestics. In
the typical Family Dollar store, the majority of the products are priced at $10 or less, with many of the products
priced at $1 or less. The Company manages its business on the basis of one operating segment.
Principles of consolidation
The consolidated financial statements include the accounts of the Company and its subsidiaries, all of which are
wholly owned. All significant intercompany balances and transactions have been eliminated.
Fiscal year
The Company’s fiscal year generally ends on the Saturday closest to August 31 of each year, which generally
results in an extra week every six years. Fiscal 2010, fiscal 2009 and fiscal 2008 were 52-week years.
Use of estimates
The preparation of the Company’s consolidated financial statements, in conformity with accounting principles
generally accepted in the United States of America, requires management to make estimates and
assumptions. These estimates and assumptions affect the reported amounts of assets and liabilities, the disclosure
of contingent assets and liabilities at the date of the financial statements and the reported amounts of revenues
and expenses during the reporting period. Actual results could differ from these estimates.
Adjustments and Reclassifications
As of August 28, 2010, the Company recorded its liabilities for workers’ compensation, general liability and auto
liability costs on a gross basis, and recorded a separate insurance asset for amounts recoverable under stop-loss
insurance policies. In addition, the Company’s gross liabilities and the related insurance asset were separated into
current and non-current amounts on the Consolidated Balance Sheets. The insurance liabilities in the Company’s
previous filings were recorded net of amounts recoverable under stop-loss insurance policies, and were classified
as current liabilities. The prior year amounts in this Report have also been adjusted to properly reflect the gross
insurance liabilities and related insurance asset, as well as the current and non-current classification on the
Consolidated Balance Sheets. The Company’s deferred income taxes related to these insurance liabilities were
also adjusted to reflect both current and non-current amounts. The changes noted above were not material and
had no impact on the Consolidated Statements of Income or Shareholders’ Equity. While certain changes were
made to the operating section of the Consolidated Statements of Cash Flows to reflect the changes in operating
assets and liabilities, there was no impact on total cash flows from operating activities, investing activities or
financing activities.
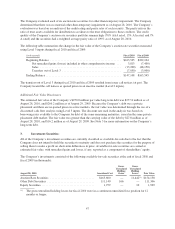
The Company’s total liabilities for workers’ compensation, general liability and auto liability costs were $249.4
million ($63.7 million current and $185.7 million non-current) as of the end of fiscal 2010 and $255.6 million
($56.7 million current and $198.9 million non-current) as of the end of fiscal 2009. The current portion of the
liabilities is included in accrued liabilities on the Consolidated Balance Sheets, and the non-current portion is
included in other liabilities. The insurance assets related to these amounts totaled $37.9 million ($3.2 million current
40