Family Dollar 2010 Annual Report Download - page 10
Download and view the complete annual report
Please find page 10 of the 2010 Family Dollar annual report below. You can navigate through the pages in the report by either clicking on the pages listed below, or by using the keyword search tool below to find specific information within the annual report.-
 1
1 -
 2
2 -
 3
3 -
 4
4 -
 5
5 -
 6
6 -
 7
7 -
 8
8 -
 9
9 -
 10
10 -
 11
11 -
 12
12 -
 13
13 -
 14
14 -
 15
15 -
 16
16 -
 17
17 -
 18
18 -
 19
19 -
 20
20 -
 21
21 -
22
-
23
-
24
-
25
-
26
-
27
-
28
-
29
-
30
-
31
-
32
-
33
-
34
-
35
-
36
-
37
-
38
-
39
-
40
-
41
-
42
-
43
-
44
-
45
-
46
-
47
-
48
-
49
-
50
-
51
-
52
-
53
-
54
-
55
-
56
-
57
-
58
-
59
-
60
-
61
-
62
-
63
-
64
-
65
-
66
-
67
-
68
-
69
-
70
-
71
-
72
-
73
-
74
-
75
-
76
 |
 |

Over the last several years, we have stabilized our workforce, significantly increased our store-level training
and raised our performance expectations. As a result, we have improved both our execution for the customer and
our workforce productivity. To help us drive further improvements, we are introducing new technology tools and
processes to improve workflow management and leverage our labor hours more effectively.
Store Operations
We operate more than 6,800 stores in 44 states. All of our stores are managed and operated by us. A store
manager manages each store and is responsible for hiring and training store employees, managing the financial
performance of the store, and providing quality customer service. The store manager reports to a district manager
or area operations manager. A district manager or area operations manager is typically responsible for 15 to 25
stores. During fiscal 2010, no single store accounted for more than one-quarter of one percent of sales.
Merchandise
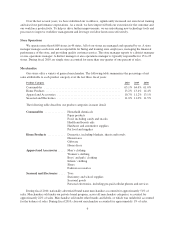
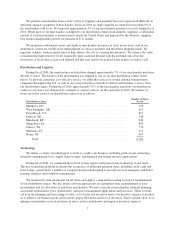
Our stores offer a variety of general merchandise. The following table summarizes the percentage of net
sales attributable to each product category over the last three fiscal years:
Product Category 2010 2009 2008
Consumables .................................................... 65.1% 64.4% 61.0%
Home Products ................................................... 13.2% 13.4% 14.4%
Apparel and Accessories ........................................... 10.7% 11.2% 13.1%
Seasonal and Electronics ........................................... 11.0% 11.0% 11.5%
The following table describes our product categories in more detail:
Consumables .............. Household chemicals
Paper products
Food, including candy and snacks
Health and beauty aids
Hardware and automotive supplies
Pet food and supplies
Home Products ............ Domestics, including blankets, sheets and towels
Housewares
Giftware
Home décor
Apparel and Accessories ..... Men’s clothing
Women’s clothing
Boys’ and girls’ clothing
Infants’ clothing
Shoes
Fashion accessories
Seasonal and Electronics .... Toys
Stationery and school supplies
Seasonal goods
Personal electronics, including pre-paid cellular phones and services
During fiscal 2010, nationally advertised brand name merchandise accounted for approximately 51% of
sales. Merchandise sold under our private brand program, across all merchandise categories, accounted for
approximately 22% of sales. Merchandise sold under other brands and labels, or which was unlabeled, accounted
for the balance of sales. During fiscal 2010, closeout merchandise accounted for approximately 1% of sales.
6