Dollar General 2005 Annual Report Download - page 60
Download and view the complete annual report
Please find page 60 of the 2005 Dollar General annual report below. You can navigate through the pages in the report by either clicking on the pages listed below, or by using the keyword search tool below to find specific information within the annual report.-
 1
1 -
2
-
3
-
4
-
5
-
6
-
7
-
8
-
9
-
10
-
11
-
12
-
13
-
14
-
15
-
16
-
17
-
18
-
19
-
20
-
21
-
22
-
23
-
24
-
25
-
26
-
27
-
28
-
29
-
30
-
31
-
32
-
33
-
34
-
35
-
36
-
37
-
38
-
39
-
40
-
41
-
42
-
43
-
44
-
45
-
46
-
47
-
48
-
49
-
 50
50 -
 51
51 -
 52
52 -
 53
53 -
 54
54 -
 55
55 -
 56
56 -
 57
57 -
 58
58 -
 59
59 -
 60
60 -
 61
61 -
 62
62 -
 63
63 -
 64
64 -
 65
65 -
 66
66 -
 67
67 -
 68
68
 |
 |

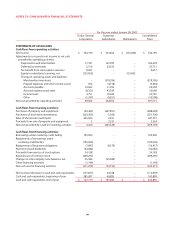
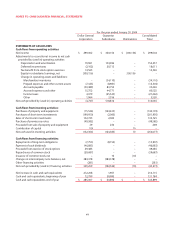
NOTES TO CONSOLIDATED FINANCIAL STATEMENTS
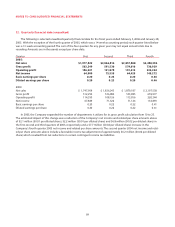
13. Guarantor subsidiaries
All of the Company’s subsidiaries, except for its not-for-profit subsidiary for which the assets and revenues are not
material (the “Guarantors”), have fully and unconditionally guaranteed on a joint and several basis the Company’s obliga-
tions under certain outstanding debt obligations. Each of the Guarantors is a direct or indirect wholly owned subsidiary of
the Company.
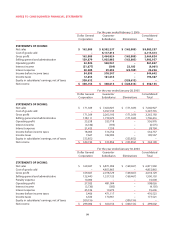
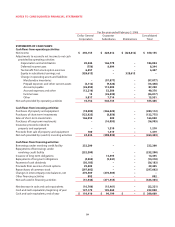
The following consolidating schedules present condensed financial information on a combined basis. Dollar amounts are
in thousands.
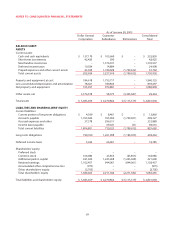
As of February 3, 2006
Dollar General Guarantor Consolidated
Corporation Subsidiaries Eliminations Total
BALANCE SHEET:
ASSETS
Current assets:
Cash and cash equivalents $ 110,410 $ 90,199 $ – $ 200,609
Short-term investments – 8,850 – 8,850
Merchandise inventories – 1,474,414 – 1,474,414
Deferred income taxes 11,808 104 – 11,912
Prepaid expenses and other current assets 89,100 794,873 (816,833) 67,140
Total current assets 211,318 2,368,440 (816,833) 1,762,925
Property and equipment, at cost 199,396 2,022,144 – 2,221,540
Less accumulated depreciation and amortization 94,701 934,667 – 1,029,368
Net property and equipment 104,695 1,087,477 – 1,192,172
Other assets, net 2,379,255 31,603 (2,373,768) 37,090
Total assets $2,695,268 $3,487,520 $(3,190,601) $ 2,992,187
LIABILITIES AND SHAREHOLDERS’ EQUITY
Current liabilities:
Current portion of long-term obligations $ (800) $ 9,585 $ – $ 8,785
Accounts payable 789,497 536,097 (817,208) 508,386
Accrued expenses and other 25,473 347,072 375 372,920
Income taxes payable 89 43,617 – 43,706
Total current liabilities 814,259 936,371 (816,833) 933,797
Long-term obligations 153,756 1,429,116 (1,312,910) 269,962
Deferred income taxes 6,458 61,175 – 67,633
Shareholders’ equity:
Preferred stock – – – –
Common stock 157,840 23,853 (23,853) 157,840
Additional paid-in capital 462,383 673,612 (673,612) 462,383
Retained earnings 1,106,165 363,393 (363,393) 1,106,165
Accumulated other comprehensive loss (794) – – (794)
Other shareholders’ equity (4,799) – – (4,799)
Total shareholders’equity1,720,795 1,060,858 (1,060,858) 1,720,795
Total liabilities and shareholders’ equity $2,695,268 $3,487,520 $(3,190,601) $ 2,992,187
56