Dollar General 2005 Annual Report Download - page 21
Download and view the complete annual report
Please find page 21 of the 2005 Dollar General annual report below. You can navigate through the pages in the report by either clicking on the pages listed below, or by using the keyword search tool below to find specific information within the annual report.-
 1
1 -
2
-
3
-
4
-
5
-
6
-
7
-
8
-
9
-
10
-
 11
11 -
 12
12 -
 13
13 -
 14
14 -
 15
15 -
 16
16 -
 17
17 -
 18
18 -
 19
19 -
 20
20 -
 21
21 -
 22
22 -
 23
23 -
 24
24 -
 25
25 -
 26
26 -
 27
27 -
 28
28 -
 29
29 -
 30
30 -
 31
31 -
32
-
33
-
34
-
35
-
36
-
37
-
38
-
39
-
40
-
41
-
42
-
43
-
44
-
45
-
46
-
47
-
48
-
49
-
50
-
51
-
52
-
53
-
54
-
55
-
56
-
57
-
58
-
59
-
60
-
61
-
62
-
63
-
64
-
65
-
66
-
67
-
68
 |
 |

17
MANAGEMENT’S DISCUSSION AND ANALYSIS OF FINANCIAL CONDITION AND RESULTS OF OPERATIONS
all distribution capacity and to decrease stem miles
between the DCs and the stores;
• We increased annual inventory turns to 4.2 times in
2005, including the 53rd week, from 4.0 times in 2004
and reduced inventory levels on a per-store basis by
1% as of year end. The Company has executed end-of-
season markdowns over the past two years to
minimize seasonal inventory carried forward to the
following year. The Company made substantial
progress on this initiative in 2005 and continues to
aggressively identify, evaluate, merchandise and
markdown aged inventory;
• We introduced Dollar General gift cards before the
Christmas holiday season;
• We introduced Fisher-Price® branded children’s
apparel and Bobbie Brooks® apparel for women in
our stores;
• We developed and installed new systems to provide
enhanced store operating statements, supplier
communications and transportation and claims
management; and
• We generated sufficient cash flow to allow the
Company to repurchase approximately 15 million
shares of its common stock for $297.6 million and
to increase our per share dividend to shareholders
by over 9%.
The Company believes its 2005 sales (particularly in
more discretionary, higher gross profit categories) were
negatively impacted by the effect on its typical low- to
middle-income customer of high gasoline and heating
fuel prices as well as higher interest rates and increasing
consumer debt levels. The Company’s gross profit rate was
negatively impacted for the year by several factors as
further discussed in “Results of Operations” below, but was
most notably affected by the decrease, as a percentage
of sales, in sales of higher gross profit merchandise
categories and higher transportation fuel costs.
In 2005, Hurricanes Katrina and Rita made landfall in
the Gulf Coast, impacting our operations, our customers,
and our employees. At the peak, approximately 350 stores
were temporarily closed due to Hurricane Katrina and 330
stores were temporarily closed due to Hurricane Rita. The
Company ultimately closed 41 stores as a result of the
hurricanes, and suffered the total destruction of inventory
in 29 of those stores due to Hurricane Katrina and 3 of
those stores due to Hurricane Rita. Significant losses of
inventory and fixed assets, in the form of store fixtures and
leasehold improvements, were caused by the hurricanes.
These losses were offset by insurance proceeds received
during the year. In addition, the Company expects to
record additional insurance proceeds in excess of the cost
of the asset losses in the future. Significant business inter-
ruption was experienced during the hurricanes.The
Company did not recover any business interruption insur-
ance proceeds during the year, and will not record any
such proceeds until the business interruption claims are
substantially settled.
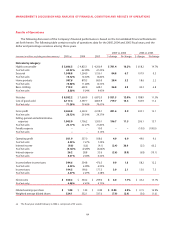
Company Performance Measures. Management uses
a number of metrics, including those indicated on the
table included in “Results of Operations” below, to assess
its performance. The following are the more frequently
discussed metrics:
• Earnings per share (“EPS”) growth is an indicator of
the increased returns generated for the Company’s
shareholders. EPS of $1.08 in 2005 reflected an
increase of 3.8 percent over EPS of $1.04 reported in
2004.
• Total net sales growth indicates, among other things,
the success of the Company’s selection of new store
locations and merchandising strategies. Total net sales
increased 12.0% in 2005, including the impact of the
53rd week.
• Same-store sales growth indicates whether our mer-
chandising strategies,store execution and customer
service in existing stores have been successful in
generating increased sales. Same-store sales increased
2.0 percent in 2005, with stronger same-store sales in
the first half of the year than the latter half. Sales were
negatively impacted for the year by the economic
factors discussed above. However, the latter half of the
year was increasingly impacted by promotional efforts
of competitors. Same-store sales in 2004 increased by
3.2 percent.
• Operating margin rate (operating profit divided by net
sales), which is an indicator of the Company’s success
in leveraging its fixed costs and managing its variable
costs, declined to 6.5 percent in 2005 versus 7.3
percent in 2004.The various components impacting
this metric are fully discussed in “Results of
Operations” below.
• Free cash flow (the sum of net cash flows from operat-
ing activities, net cash flows from investing activities
and net cash flows from financing activities, excluding
share repurchases and changes in debt other than
required payments). Although this measure is a non-
GAAP measure, the Company believes it is useful as an
indicator of the cash flow generating capacity of the
Company’s operations. It is also a useful metric to ana-
lyze in conjunction with net income to determine
whether there is any significant non-cash component
to the Company’s net income.The Company generat-