Dollar General 2005 Annual Report Download - page 23
Download and view the complete annual report
Please find page 23 of the 2005 Dollar General annual report below. You can navigate through the pages in the report by either clicking on the pages listed below, or by using the keyword search tool below to find specific information within the annual report.-
 1
1 -
2
-
3
-
4
-
5
-
6
-
7
-
8
-
9
-
10
-
11
-
12
-
 13
13 -
 14
14 -
 15
15 -
 16
16 -
 17
17 -
 18
18 -
 19
19 -
 20
20 -
 21
21 -
 22
22 -
 23
23 -
 24
24 -
 25
25 -
 26
26 -
 27
27 -
 28
28 -
 29
29 -
 30
30 -
 31
31 -
 32
32 -
 33
33 -
34
-
35
-
36
-
37
-
38
-
39
-
40
-
41
-
42
-
43
-
44
-
45
-
46
-
47
-
48
-
49
-
50
-
51
-
52
-
53
-
54
-
55
-
56
-
57
-
58
-
59
-
60
-
61
-
62
-
63
-
64
-
65
-
66
-
67
-
68
 |
 |

19
MANAGEMENT’S DISCUSSION AND ANALYSIS OF FINANCIAL CONDITION AND RESULTS OF OPERATIONS
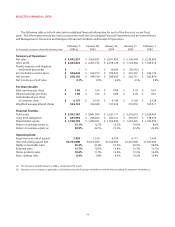
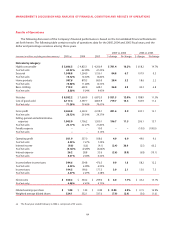
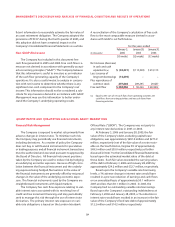
Results of Operations
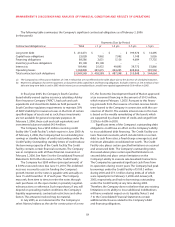
The following discussion of the Company’s financial performance is based on the Consolidated Financial Statements
set forth herein. The following table contains results of operations data for the 2005, 2004 and 2003 fiscal years, and the
dollar and percentage variances among those years.
2005 vs. 2004 2004 vs. 2003
(amounts in millions, excluding per share amounts) 2005
(a)
2004 2003 $ change % change $ change % change
Net sales by category:
Highly consumable $ 5,606.5 $ 4,825.1 $ 4,206.9 $ 781.4 16.2% $ 618.2 14.7%
% of net sales 65.33% 62.98% 61.22%
Seasonal 1,348.8 1,264.0 1,156.1 84.8 6.7 107.9 9.3
% of net sales 15.72% 16.50% 16.82%
Home products 907.8 879.5 860.9 28.4 3.2 18.6 2.2
% of net sales 10.58% 11.48% 12.53%
Basic clothing 719.2 692.4 648.1 26.8 3.9 44.3 6.8
% of net sales 8.38%9.04%9.43%
Net sales $ 8,582.2 $ 7,660.9 $ 6,872.0 $ 921.3 12.0% $ 788.9 11.5%
Cost of goods sold 6,117.4 5,397.7 4,853.9 719.7 13.3 543.9 11.2
% of net sales 71.28%70.46%70.63%
Gross profit 2,464.8 2,263.2 2,018.1 201.6 8.9 245.1 12.1
% of net sales 28.72%29.54% 29.37%
Selling, general and administrative
expenses 1,903.0 1,706.2 1,500.1 196.7 11.5 206.1 13.7
% of net sales 22.17% 22.27% 21.83%
Penalty expense –– 10.0 ––(10.0) (100.0)
% of net sales ––0.15%
Operating profit 561.9 557.0 508.0 4.9 0.9 49.0 9.6
% of net sales 6.55% 7.27% 7.39%
Interest income (9.0) (6.6) (4.1) (2.4) 36.9 (2.5) 60.2
% of net sales (0.10)% (0.09)% (0.06)%
Interest expense 26.2 28.8 35.6 (2.6) (8.9) (6.8) (19.1)
% of net sales 0.31%0.38%0.52%
Income before income taxes 544.6 534.8 476.5 9.9 1.8 58.2 12.2
% of net sales 6.35%6.98% 6.93%
Income taxes 194.5 190.6 177.5 3.9 2.1 13.0 7.3
% of net sales 2.27% 2.49% 2.58%
Net income $ 350.2 $ 344.2 $ 299.0 $ 6.0 1.7% $ 45.2 15.1%
% of net sales 4.08% 4.49% 4.35%
Diluted earnings per share $ 1.08 $ 1.04 $ 0.89 $ 0.04 3.8% $ 0.15 16.9%
Weighted average diluted shares 324.1 332.1 337.6 (7.9) (2.4) (5.6) (1.6)
(a) The fiscal year ended February 3, 2006 is comprised of 53 weeks.