Dollar General 2005 Annual Report Download - page 40
Download and view the complete annual report
Please find page 40 of the 2005 Dollar General annual report below. You can navigate through the pages in the report by either clicking on the pages listed below, or by using the keyword search tool below to find specific information within the annual report.-
 1
1 -
2
-
3
-
4
-
5
-
6
-
7
-
8
-
9
-
10
-
11
-
12
-
13
-
14
-
15
-
16
-
17
-
18
-
19
-
20
-
21
-
22
-
23
-
24
-
25
-
26
-
27
-
28
-
29
-
 30
30 -
 31
31 -
 32
32 -
 33
33 -
 34
34 -
 35
35 -
 36
36 -
 37
37 -
 38
38 -
 39
39 -
 40
40 -
 41
41 -
 42
42 -
 43
43 -
 44
44 -
 45
45 -
 46
46 -
 47
47 -
 48
48 -
 49
49 -
 50
50 -
51
-
52
-
53
-
54
-
55
-
56
-
57
-
58
-
59
-
60
-
61
-
62
-
63
-
64
-
65
-
66
-
67
-
68
 |
 |

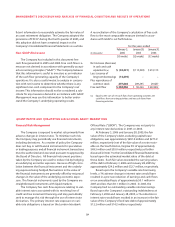
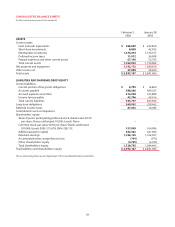
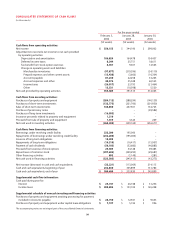
36
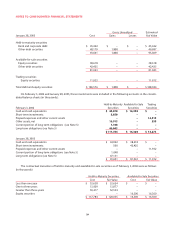
CONSOLIDATED STATEMENTS OF CASH FLOWS
(In thousands)
For the years ended
February 3, January 28, January 30,
2006 2005 2004
(53 weeks) (52 weeks) (52 weeks)
Cash flows from operating activities:
Net income $ 350,155 $ 344,190 $ 299,002
Adjustments to reconcile net income to net cash provided
by operating activities:
Depreciation and amortization 186,824 164,478 154,457
Deferred income taxes 8,244 25,751 18,611
Tax benefit from stock option exercises 6,457 9,657 14,565
Change in operating assets and liabilities:
Merchandise inventories (97,877) (219,396) (34,110)
Prepaid expenses and other current assets (13,438) (3,666) (16,304)
Accounts payable 87,230 22,258 33,265
Accrued expenses and other 40,376 35,048 60,523
Income taxes (26,017) 23,793 (21,464)
Other 13,531 (10,598) 5,520
Net cash provided by operating activities 555,485 391,515 514,065
Cash flows from investing activities:
Purchases of property and equipment (284,112) (288,294) (140,139)
Purchases of short–term investments (132,775) (221,700) (201,950)
Sales of short-term investments 166,850 247,501 134,725
Purchase of promissory notes –– (49,582)
Purchases of long-term investments (16,995) – –
Insurance proceeds related to property and equipment 1,210 – –
Proceeds from sale of property and equipment 1,419 3,324 269
Net cash used in investing activities (264,403) (259,169) (256,677)
Cash flows from financing activities:
Borrowings under revolving credit facility 232,200 195,000 –
Repayments of borrowings under revolving credit facility (232,200) (195,000) –
Issuance of long-term obligations 14,495 – –
Repayments of long-term obligations (14,310) (16,417) (15,907)
Payment of cash dividends (56,183) (52,682) (46,883)
Proceeds from exercise of stock options 29,405 34,128 49,485
Repurchases of common stock (297,602) (209,295) (29,687)
Other financing activities 892 (1,149) (281)
Net cash used in financing activities (323,303) (245,415) (43,273)
Net increase (decrease) in cash and cash equivalents (32,221) (113,069) 214,115
Cash and cash equivalents, beginning of year 232,830 345,899 131,784
Cash and cash equivalents, end of year $ 200,609 $ 232,830 $ 345,899
Supplemental cash flow information:
Cash paid during year for:
Interest $ 25,747 $ 26,748 $ 31,256
Income taxes $ 205,802 $ 133,100 $ 165,248
Supplemental schedule of noncash investing and financing activities:
Purchases of property and equipment awaiting processing for payment,
included in Accounts payable $ 24,750 $ 12,921 $ 9,643
Purchases of property and equipment under capital lease obligations $ 7,197 $ 5,722 $ 996
The accompanying notes are an integral part of the consolidated financial statements.