Dollar General 2005 Annual Report Download - page 33
Download and view the complete annual report
Please find page 33 of the 2005 Dollar General annual report below. You can navigate through the pages in the report by either clicking on the pages listed below, or by using the keyword search tool below to find specific information within the annual report.-
 1
1 -
2
-
3
-
4
-
5
-
6
-
7
-
8
-
9
-
10
-
11
-
12
-
13
-
14
-
15
-
16
-
17
-
18
-
19
-
20
-
21
-
22
-
 23
23 -
 24
24 -
 25
25 -
 26
26 -
 27
27 -
 28
28 -
 29
29 -
 30
30 -
 31
31 -
 32
32 -
 33
33 -
 34
34 -
 35
35 -
 36
36 -
 37
37 -
 38
38 -
 39
39 -
 40
40 -
 41
41 -
 42
42 -
 43
43 -
44
-
45
-
46
-
47
-
48
-
49
-
50
-
51
-
52
-
53
-
54
-
55
-
56
-
57
-
58
-
59
-
60
-
61
-
62
-
63
-
64
-
65
-
66
-
67
-
68
 |
 |

29
MANAGEMENT’S DISCUSSION AND ANALYSIS OF FINANCIAL CONDITION AND RESULTS OF OPERATIONS
ficient information to reasonably estimate the fair value of
an asset retirement obligation. The Company adopted the
provisions of FIN 47 during the fourth quarter of 2005, and
this adoption did not have a material impact on the
Company’s Consolidated Financial Statements as a whole.
Non-GAAP disclosures
The Company has included in this document free
cash flow generated in 2005 and 2004. Free cash flow is a
measure not derived in accordance with generally accept-
ed accounting principles (“GAAP”). The Company believes
that this information is useful to investors as an indicator
of the cash flow generating capacity of the Company’s
operations. It is also a useful metric to analyze in conjunc-
tion with net income to determine whether there is any
significant non-cash component to the Company’s net
income.This information should not be considered a sub-
stitute for any measures derived in accordance with GAAP.
Management may use this information to better under-
stand the Company’s underlying operating results.
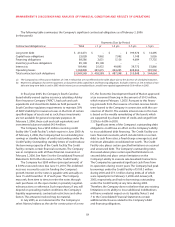
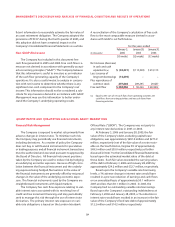
A reconciliation of the Company’s calculation of free cash
flow to the most comparable measure derived in accor-
dance with GAAP is set forth below.
For the years ended
February 3, January 28, January 30,
(In thousands) 2006 2005 2004
(53 weeks) (52 weeks) (52 weeks)
Net increase (decrease)
in cash and cash
equivalents
(a)
$ (32,221) $(113,069) $ 214,115
Less issuance of
long-term borrowings (14,495) ––
Plus repurchases of
common stock 297,602 209,295 29,687
Free cash flow $ 250,886 $ 96,226 $ 243,802
(a) Equal to the sum of net cash flows from operating activities, net
cash flows from investing activities and net cash flows from
financing activities.
Financial Risk Management
The Company is exposed to market risk primarily from
adverse changes in interest rates. To minimize such risk,
the Company may periodically use financial instruments,
including derivatives. As a matter of policy, the Company
does not buy or sell financial instruments for speculative
or trading purposes and all financial instrument transactions
must be authorized and executed pursuant to approval by
the Board of Directors. All financial instrument positions
taken by the Company are used to reduce risk by hedging
an underlying economic exposure. Because of high corre-
lation between the financial instrument and the underly-
ing exposure being hedged, fluctuations in the value of
the financial instruments are generally offset by reciprocal
changes in the value of the underlying economic expo-
sure. The financial instruments used by the Company are
straightforward instruments with liquid markets.
The Company has cash flow exposure relating to vari-
able interest rates associated with its revolving line of
credit and tax increment financing,and may periodically
seek to manage this risk through the use of interest rate
derivatives. The primary interest rate exposure on vari-
able rate obligations is based on the London Interbank
Offered Rate (“LIBOR”). The Company was not party to
any interest rate derivatives in 2005 or 2004.
At February 3, 2006 and January 28, 2005, the fair
value of the Company’s debt, excluding capital lease
obligations, was approximately $281.0 million and $275.9
million, respectively (net of the fair value of a note receiv-
able on the South Boston, Virginia DC of approximately
$49.5 million and $50.0 million, respectively, as further
discussed in Note 7 to the Consolidated Financial Statements),
based upon the estimated market value of the debt at
those dates. Such fair value exceeded the carrying values
of the debt at February 3, 2006 and January 28, 2005 by
approximately $24.2 million and $32.7 million, respectively.
Based upon the Company’s variable rate borrowing
levels, a 1% adverse change in interest rates would have
resulted in a pre-tax reduction of earnings and cash flows
on an annualized basis of approximately $0.1 million in
2005 and less than $0.1 million in 2004. In 2003, the
Company had no outstanding variable rate borrowings.
Based upon the Company’s outstanding indebtedness at
February 3, 2006 and January 28, 2005, a 1% reduction in
interest rates would have resulted in an increase in the fair
value of the Company’s fixed rate debt of approximately
$12.2 million and $14.2 million, respectively.
QUANTITATIVE AND QUALITATIVE DISCLOSURES ABOUT MARKET RISK