Dollar General 2005 Annual Report Download - page 43
Download and view the complete annual report
Please find page 43 of the 2005 Dollar General annual report below. You can navigate through the pages in the report by either clicking on the pages listed below, or by using the keyword search tool below to find specific information within the annual report.-
 1
1 -
2
-
3
-
4
-
5
-
6
-
7
-
8
-
9
-
10
-
11
-
12
-
13
-
14
-
15
-
16
-
17
-
18
-
19
-
20
-
21
-
22
-
23
-
24
-
25
-
26
-
27
-
28
-
29
-
30
-
31
-
32
-
 33
33 -
 34
34 -
 35
35 -
 36
36 -
 37
37 -
 38
38 -
 39
39 -
 40
40 -
 41
41 -
 42
42 -
 43
43 -
 44
44 -
 45
45 -
 46
46 -
 47
47 -
 48
48 -
 49
49 -
 50
50 -
 51
51 -
 52
52 -
 53
53 -
54
-
55
-
56
-
57
-
58
-
59
-
60
-
61
-
62
-
63
-
64
-
65
-
66
-
67
-
68
 |
 |

39
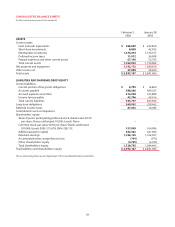
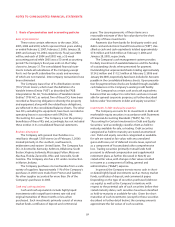
NOTES TO CONSOLIDATED FINANCIAL STATEMENTS
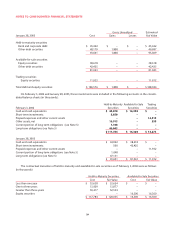
Gross Unrealized Estimated
January 28, 2005 Cost Gains Losses Fair Value
Held-to-maturity securities
Bank and corporate debt $ 45,422 $ – $ – $ 45,422
Other debt securities 48,179 1,808 – 49,987
93,601 1,808 – 95,409
Available-for-sale securities
Equity securities 38,618 – – 38,618
Other debt securities 42,425 – – 42,425
81,043 – – 81,043
Trading securities
Equity securities 11,932 – – 11,932
Total debt and equity securities $ 186,576 $ 1,808 $ – $ 188,384
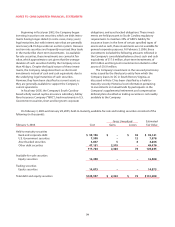
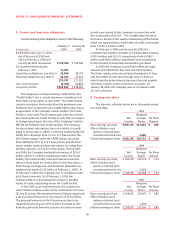
On February 3, 2006 and January 28, 2005, these investments were included in the following accounts in the consoli-
dated balance sheets (in thousands):
Held-to-Maturity Available-for-Sale Trading
February 3, 2006 Securities Securities Securities
Cash and cash equivalents $44,870 $16,300 $ –
Short-term investments 8,850 ––
Prepaid expenses and other current assets – – 14,515
Other assets,net 16,913 –358
Current portion of long-term obligations (see Note 5) 1,108 – –
Long-term obligations (see Note 5) 46,043 – –
$117,784 $16,300 $ 14,873
January 28, 2005
Cash and cash equivalents $ 44,922 $ 38,618 $ –
Short-term investments 500 42,425 –
Prepaid expenses and other current assets – – 11,932
Current portion of long-term obligations (see Note 5) 1,048 – –
Long-term obligations (see Note 5) 47,131 – –
$ 93,601 $ 81,043 $ 11,932
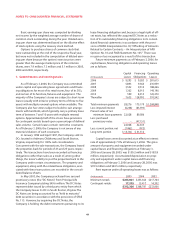
The contractual maturities of held-to-maturity and available-for-sale securities as of February 3, 2006 were as follows
(in thousands):
Held-to-Maturity Securities Available-for-Sale Securities
Cost Fair Value Cost Fair Value
Less than one year $ 53,638 $ 53,624 $ – $ –
One to three years 13,929 13,877 – –
Greater than three years 50,217 52,534 – –
Equity securities – – 16,300 16,300
$ 117,784 $ 120,035 $ 16,300 $ 16,300