Dollar General 2005 Annual Report Download - page 59
Download and view the complete annual report
Please find page 59 of the 2005 Dollar General annual report below. You can navigate through the pages in the report by either clicking on the pages listed below, or by using the keyword search tool below to find specific information within the annual report.-
 1
1 -
2
-
3
-
4
-
5
-
6
-
7
-
8
-
9
-
10
-
11
-
12
-
13
-
14
-
15
-
16
-
17
-
18
-
19
-
20
-
21
-
22
-
23
-
24
-
25
-
26
-
27
-
28
-
29
-
30
-
31
-
32
-
33
-
34
-
35
-
36
-
37
-
38
-
39
-
40
-
41
-
42
-
43
-
44
-
45
-
46
-
47
-
48
-
 49
49 -
 50
50 -
 51
51 -
 52
52 -
 53
53 -
 54
54 -
 55
55 -
 56
56 -
 57
57 -
 58
58 -
 59
59 -
 60
60 -
 61
61 -
 62
62 -
 63
63 -
 64
64 -
 65
65 -
 66
66 -
 67
67 -
 68
68
 |
 |

55
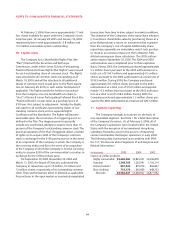
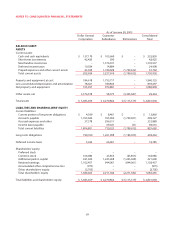
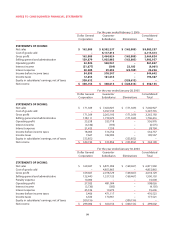
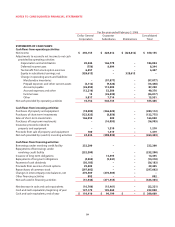
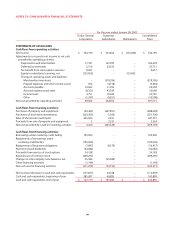
NOTES TO CONSOLIDATED FINANCIAL STATEMENTS
12. Quarterly financial data (unaudited)
The following is selected unaudited quarterly financial data for the fiscal years ended February 3, 2006 and January 28,
2005. With the exception of the fourth quarter of 2005, which was a 14-week accounting period, each quarter listed below
was a 13-week accounting period. The sum of the four quarters for any given year may not equal annual totals due to
rounding. Amounts are in thousands except per share data.
Quarter First Second Third Fourth
2005:
Net sales $1,977,829 $2,066,016 $2,057,888 $2,480,504
Gross profit 563,349 591,530 579,016 730,929
Operating profit 106,921 121,070 101,612 232,264
Net income 64,900 75,558 64,425 145,272
Basic earnings per share 0.20 0.23 0.20 0.46
Diluted earnings per share 0.20 0.23 0.20 0.46
2004:
Net sales $1,747,959 $1,836,243 $ 1,879,187 $ 2,197,538
Gross profit 512,250 536,980 553,985 659,977
Operating profit 114,550 108,126 113,956 220,344
Net income 67,849 71,322 71,126 133,893
Basic earnings per share 0.20 0.22 0.22 0.41
Diluted earnings per share 0.20 0.22 0.22 0.41
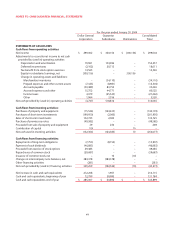
In 2005, the Company expanded the number of departments it utilizes for its gross profit calculation from 10 to 23.
The estimated impact of this change was a reduction of the Company’s net income and related per share amounts above
of $2.1 million ($0.01 per diluted share), $2.2 million ($0.01 per diluted share) and $6.8 million ($0.02 per diluted share) in
the first, second and third quarters of 2005, respectively, and a $7.7 million ($0.02 per diluted share) increase in the
Company’s fourth quarter 2005 net income and related per share amounts.The second quarter 2004 net income and relat-
ed per share amounts above include a favorable income tax adjustment of approximately $6.2 million ($0.02 per diluted
share) which resulted from net reductions in certain contingent income tax liabilities.