Dollar General 2005 Annual Report Download - page 38
Download and view the complete annual report
Please find page 38 of the 2005 Dollar General annual report below. You can navigate through the pages in the report by either clicking on the pages listed below, or by using the keyword search tool below to find specific information within the annual report.-
 1
1 -
2
-
3
-
4
-
5
-
6
-
7
-
8
-
9
-
10
-
11
-
12
-
13
-
14
-
15
-
16
-
17
-
18
-
19
-
20
-
21
-
22
-
23
-
24
-
25
-
26
-
27
-
 28
28 -
 29
29 -
 30
30 -
 31
31 -
 32
32 -
 33
33 -
 34
34 -
 35
35 -
 36
36 -
 37
37 -
 38
38 -
 39
39 -
 40
40 -
 41
41 -
 42
42 -
 43
43 -
 44
44 -
 45
45 -
 46
46 -
 47
47 -
 48
48 -
49
-
50
-
51
-
52
-
53
-
54
-
55
-
56
-
57
-
58
-
59
-
60
-
61
-
62
-
63
-
64
-
65
-
66
-
67
-
68
 |
 |

34
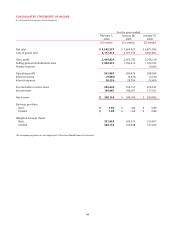
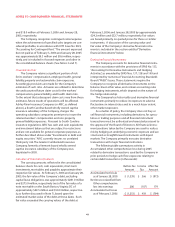
CONSOLIDATED STATEMENTS OF INCOME
(In thousands except per share amounts)
For the years ended
February 3, January 28, January 30,
2006 2005 2004
(53 weeks) (52 weeks) (52 weeks)
Net sales $ 8,582,237 $ 7,660,927 $ 6,871,992
Cost of goods sold 6,117,413 5,397,735 4,853,863
Gross profit 2,464,824 2,263,192 2,018,129
Selling, general and administrative 1,902,957 1,706,216 1,500,103
Penalty expense – – 10,000
Operating profit 561,867 556,976 508,026
Interest income (9,001) (6,575) (4,103)
Interest expense 26,226 28,794 35,606
Income before income taxes 544,642 534,757 476,523
Income taxes 194,487 190,567 177,521
Net income $ 350,155 $ 344,190 $ 299,002
Earnings per share:
Basic $ 1.09 $ 1.04 $ 0.89
Diluted $1.08 $1.04 $0.89
Weighted average shares:
Basic 321,835 329,376 334,697
Diluted 324,133 332,068 337,636
The accompanying notes are an integral part of the consolidated financial statements.