Dollar General 2005 Annual Report Download - page 25
Download and view the complete annual report
Please find page 25 of the 2005 Dollar General annual report below. You can navigate through the pages in the report by either clicking on the pages listed below, or by using the keyword search tool below to find specific information within the annual report.-
 1
1 -
2
-
3
-
4
-
5
-
6
-
7
-
8
-
9
-
10
-
11
-
12
-
13
-
14
-
 15
15 -
 16
16 -
 17
17 -
 18
18 -
 19
19 -
 20
20 -
 21
21 -
 22
22 -
 23
23 -
 24
24 -
 25
25 -
 26
26 -
 27
27 -
 28
28 -
 29
29 -
 30
30 -
 31
31 -
 32
32 -
 33
33 -
 34
34 -
 35
35 -
36
-
37
-
38
-
39
-
40
-
41
-
42
-
43
-
44
-
45
-
46
-
47
-
48
-
49
-
50
-
51
-
52
-
53
-
54
-
55
-
56
-
57
-
58
-
59
-
60
-
61
-
62
-
63
-
64
-
65
-
66
-
67
-
68
 |
 |

21
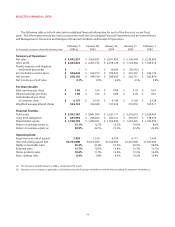
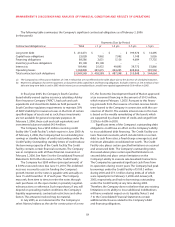
MANAGEMENT’S DISCUSSION AND ANALYSIS OF FINANCIAL CONDITION AND RESULTS OF OPERATIONS
in 2004 as compared to 2003; and a nonrecurring favor-
able inventory adjustment in 2003 of $7.8 million, repre-
senting a change in the Company’s estimated provision
for shrinkage.
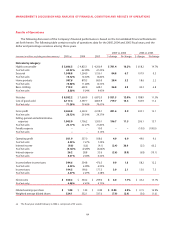
Selling, General and Administrative (“SG&A”) Expense.
The 10 basis point decrease in SG&A expense as a percent-
age of sales in 2005 as compared with 2004 was due to
a number of factors, including but not limited to the
following expense categories that either declined or
increased less than the 12.0% increase in sales: employee
incentive compensation expense (decreased 37.8%), based
upon the Company’s fiscal 2005 financial performance;
professional fees (decreased 32.3%), primarily due to the
reduction of consulting fees associated with the EZstore
project and 2004 fees associated with the Company’s
initial Sarbanes-Oxley compliance effort; and employee
health benefits (decreased 10.0%), due in part to a down-
ward revision in claim lag assumptions based upon review
and recommendation by the Company’s outside actuary
and decreased claims costs as a percentage of sales.
Partially offsetting these reductions in SG&A were current
year increases in store occupancy costs (increased 17.6%),
primarily due to rising average monthly rentals associated
with the Company’s leased store locations, and store
utilities costs (increased 22.7%) primarily related to
increased electricity and gas expense.
The increase in SG&A expense as a percentage of
sales in 2004 as compared with 2003 was due to a number
of factors,including but not limited to increases in the
following expense categories that were in excess of the
11.5 percent increase in sales: store occupancy costs
(increased 17.4%), primarily due to rising average monthly
rentals associated with the Company’s leased store
locations; purchased services (increased 54.6%), due pri-
marily to fees associated with the increased customer
usage of debit cards; professional fees (increased 119.2%),
primarily due to consulting fees associated with both the
Company’s 2004 EZstore project and compliance with
certain provisions of the Sarbanes-Oxley Act of 2002; and
inventory services (increased 88.2%), due to both an
increased number of physical inventories and a higher
average cost per physical inventory. Partially offsetting
these increases was a reduction in accruals for employee
bonus expenses (declined 21.3%), primarily related to
higher bonus expense in 2003 resulting from the
Company’s financial performance during 2003.
Penalty Expense. During 2003, the Company recorded
a charge of $10.0 million relating to a civil penalty result-
ing from its agreement in principle with the Securities and
Exchange Commission (“SEC”) staff to settle the matters
arising out of a restatement of the Company’s financial
statements for fiscal years 2001 and prior.
Interest Income. The increase in interest income in
2005 compared to 2004 is due primarily to higher interest
earned on short-term investments due to increased
interest rates on short-term borrowings.The increase in
interest income in 2004 compared to 2003 is due primarily
to interest income on certain notes receivable purchased
in May 2003 relating to the Company’s South Boston
DC, as further discussed below under Liquidity and
Capital Resources.
Interest Expense. The decrease in interest expense in
2005 is primarily attributable to a reduction in tax related
interest expense of $1.4 million, principally due to the
reversal of interest accruals pertaining to certain income
tax related contingencies that were resolved during 2005.
The decrease in interest expense in 2004 compared to
2003 is due primarily to capitalized interest of $3.6 million
related to the Company’s DC construction and expansion
projects in 2004 compared to $0.2 million in 2003 and a
reduction in amortization of debt issuance costs of $2.2
million due in part to the amendment of the Company’s
revolving credit facility in June 2004.The Company had
variable-rate debt of $14.5 million as of February 3, 2006.
The remainder of the Company’s outstanding indebted-
ness at February 3, 2006 and all of its outstanding indebt-
edness at January 28, 2005 was fixed rate debt.
Income Taxes. The effective income tax rates for 2005,
2004 and 2003 were 35.7%, 35.6% and 37.3%, respectively.
While the 2005 and 2004 rates were similar overall,
the rates contained offsetting differences. Non-recurring
factors causing the 2005 tax rate to increase when
compared to the 2004 tax rate include a reduction in fed-
eral jobs credits of approximately $1.0 million, additional
net foreign income tax expense of approximately $0.8
million and a decrease in the contingent income tax
reserve due to resolution of contingent liabilities that is
$3.6 million less than the decrease that occurred in 2004.
Non-recurring factors causing the 2005 tax rate to
decrease when compared to the 2004 tax rate include the
recognition of state tax credits of approximately $2.3
million related to the Company’s construction of a DC
in Indiana and a non-recurring benefit of approximately
$2.6 million related to an internal restructuring that was
completed during 2005. Excluding the non-recurring