Dollar General 2005 Annual Report Download - page 52
Download and view the complete annual report
Please find page 52 of the 2005 Dollar General annual report below. You can navigate through the pages in the report by either clicking on the pages listed below, or by using the keyword search tool below to find specific information within the annual report.-
 1
1 -
2
-
3
-
4
-
5
-
6
-
7
-
8
-
9
-
10
-
11
-
12
-
13
-
14
-
15
-
16
-
17
-
18
-
19
-
20
-
21
-
22
-
23
-
24
-
25
-
26
-
27
-
28
-
29
-
30
-
31
-
32
-
33
-
34
-
35
-
36
-
37
-
38
-
39
-
40
-
41
-
 42
42 -
 43
43 -
 44
44 -
 45
45 -
 46
46 -
 47
47 -
 48
48 -
 49
49 -
 50
50 -
 51
51 -
 52
52 -
 53
53 -
 54
54 -
 55
55 -
 56
56 -
 57
57 -
 58
58 -
 59
59 -
 60
60 -
 61
61 -
 62
62 -
63
-
64
-
65
-
66
-
67
-
68
 |
 |

48
NOTES TO CONSOLIDATED FINANCIAL STATEMENTS
Basic earnings per share was computed by dividing
net income by the weighted average number of shares of
common stock outstanding during the year. Diluted earn-
ings per share was determined based on the dilutive effect
of stock options using the treasury stock method.
Options to purchase shares of common stock that
were outstanding at the end of the respective fiscal year,
but were not included in the computation of diluted earn-
ings per share because the options’ exercise prices were
greater than the average market price of the common
shares, were 7.9 million, 7.3 million and 5.1 million in 2005,
2004 and 2003, respectively.
7. Commitments and contingencies
As of February 3, 2006, the Company was committed
under capital and operating lease agreements and financ-
ing obligations for most of its retail stores, four of its DCs,
and certain of its furniture, fixtures and equipment. The
majority of the Company’s stores are subject to short-term
leases (usually with initial or primary terms of three to five
years) with multiple renewal options when available. The
Company also has stores subject to build-to-suit arrange-
ments with landlords, which typically carry a primary lease
term of between 7 and 10 years with multiple renewal
options. Approximately half of the stores have provisions
for contingent rentals based upon a percentage of defined
sales volume. Certain leases contain restrictive covenants.
As of February 3, 2006, the Company is not aware of any
material violations of such covenants.
In January 1999 and April 1997, the Company sold its
DCs located in Ardmore, Oklahoma and South Boston,
Virginia, respectively, for 100% cash consideration.
Concurrent with the sale transactions, the Company leased
the properties back for periods of 23 and 25 years, respec-
tively. The transactions have been recorded as financing
obligations rather than sales as a result of, among other
things, the lessor’s ability to put the properties back to the
Company under certain circumstances. The property and
equipment, along with the related lease obligations, asso-
ciated with these transactions are recorded in the consoli-
dated balance sheets.
In May 2003, the Company purchased two secured
promissory notes (the “DC Notes”) from Principal Life
Insurance Company totaling $49.6 million. The DC Notes
represent debt issued by a third party entity from which
the Company leases its DC in South Boston,Virginia. The
DC Notes are being accounted for as “held to maturity”
debt securities in accordance with the provisions of SFAS
No. 115. However, by acquiring the DC Notes, the
Company is holding the debt instruments pertaining to its
lease financing obligation and, because a legal right of off-
set exists, has reflected the acquired DC Notes as a reduc-
tion of its outstanding financing obligations in its consoli-
dated financial statements in accordance with the provi-
sions of FASB Interpretation No. 39,“Offsetting of Amounts
Related to Certain Contracts – An Interpretation of APB
Opinion No. 10 and FASB Statement No. 105.” There was
no gain or loss recognized as a result of this transaction.
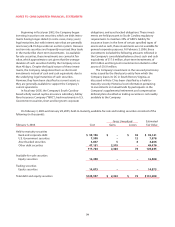
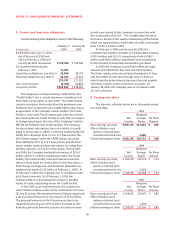
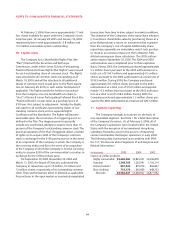
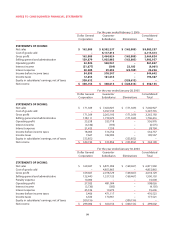
Future minimum payments as of February 3, 2006, for
capital leases, financing obligations and operating leases
are as follows:
Capital Financing Operating
(In thousands) Leases Obligations Leases
2006 $ 9,293 $ 9,283 $ 281,615
2007 5,895 9,564 235,959
2008 3,552 9,510 188,266
2009 1,302 8,915 149,196
2010 599 8,915 120,270
Thereafter 7,635 128,992 393,542
Total minimum payments 28,276 175,179 $1,368,848
Less: imputed interest (6,248) (85,593)
Present value of net
minimum lease payments 22,028 89,586
Less: purchased
promissory notes – (47,151)
22,028 42,435
Less: current portion, net (7,862) (923)
Long-term portion $ 14,166 $ 41,512
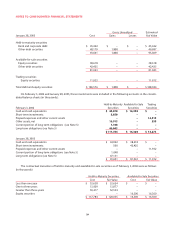
Capital leases were discounted at an effective interest
rate of approximately 7.9% at February 3, 2006. The gross
amount of property and equipment recorded under
capital leases and financing obligations at February 3,
2006 and January 28, 2005, was $150.2 million and $183.8
million, respectively. Accumulated depreciation on prop-
erty and equipment under capital leases and financing
obligations at February 3, 2006 and January 28, 2005, was
$70.5 million and $94.5 million, respectively.
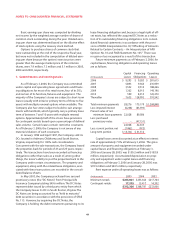
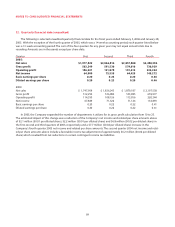
Rent expense under all operating leases was as follows:
(In thousands) 2005 2004 2003
Minimum rentals $295,061 $253,364 $217,704
Contingent rentals 17,245 15,417 14,302
$312,306 $268,781 $232,006