Dollar General 2005 Annual Report Download - page 24
Download and view the complete annual report
Please find page 24 of the 2005 Dollar General annual report below. You can navigate through the pages in the report by either clicking on the pages listed below, or by using the keyword search tool below to find specific information within the annual report.-
 1
1 -
2
-
3
-
4
-
5
-
6
-
7
-
8
-
9
-
10
-
11
-
12
-
13
-
 14
14 -
 15
15 -
 16
16 -
 17
17 -
 18
18 -
 19
19 -
 20
20 -
 21
21 -
 22
22 -
 23
23 -
 24
24 -
 25
25 -
 26
26 -
 27
27 -
 28
28 -
 29
29 -
 30
30 -
 31
31 -
 32
32 -
 33
33 -
 34
34 -
35
-
36
-
37
-
38
-
39
-
40
-
41
-
42
-
43
-
44
-
45
-
46
-
47
-
48
-
49
-
50
-
51
-
52
-
53
-
54
-
55
-
56
-
57
-
58
-
59
-
60
-
61
-
62
-
63
-
64
-
65
-
66
-
67
-
68
 |
 |

20
MANAGEMENT’S DISCUSSION AND ANALYSIS OF FINANCIAL CONDITION AND RESULTS OF OPERATIONS
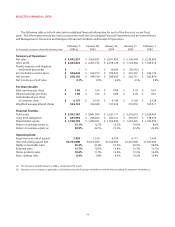
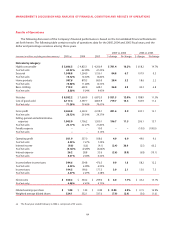
Net Sales. Increases in 2005 net sales resulted primari-
ly from opening additional stores, including 609 net new
stores in 2005, and a same-store sales increase of 2.0% for
2005 compared to 2004. Same-store sales calculations for
2005 and prior include only those stores that were open
both at the end of that period and at the beginning of the
preceding fiscal year. Same-store sales increases are
calculated based on the comparable calendar weeks
in the prior year. Accordingly, the same store sales
percentage for 2005 discussed above excludes sales from
the 53rd week as there was no comparable week in 2004.
The increase in same-store sales accounted for $144.2
million of the increase in sales. Stores opened since the
beginning of 2004, as well as the $162.9 million impact of
the 53rd week of sales in fiscal year 2005 for all stores were
the primary contributors to the remaining $777.1 million
sales increase during 2005. The increase in same-store
sales is primarily attributable to an increase in average
customer purchase.
The Company has recently revised and published its
method for determining the stores that are included in the
Company’s publicly released same-store sales calculations.
Beginning in fiscal 2006, the Company now provides same-
store sales calculations for those stores that have been open
at least 13 full fiscal months and remain open at the end of
the reporting period. Using the revised methodology, the
same-store sales increase in 2005 was 2.2%.
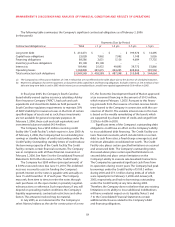
The Company monitors its sales internally by the four
major categories noted in the table above. The Company’s
merchandising mix in recent years has shifted to faster-
turning consumable products versus seasonal, home
products and clothing.This has been driven by customer
wants and needs in the marketplace. As a result, over the
past three years the highly consumable category has
become a greater percentage of the Company’s overall
sales mix while the percentages of the seasonal, home
products and basic clothing categories have declined.
Accordingly, the Company’s sales increase by merchandise
category in 2005 compared to 2004 was primarily attribut-
able to the highly consumable category, which increased
by $781.4 million, or 16.2%. The Company believes that
future sales growth is dependent upon an increase in the
number of customer transactions as well as an increase in
the dollar value of the average transaction. The Company
continually reviews its merchandise mix and strives to
adjust it when deemed necessary as a part of its ongoing
efforts to improve overall sales and gross profit.These
ongoing reviews may result in a shift in the Company’s
merchandising strategy which could increase permanent
markdowns in the future.
The Company’s sales increase in 2004 compared to
2003 resulted primarily from opening additional stores,
including 620 net new stores in 2004, and a same-store
sales increase of 3.2% for 2004 compared to 2003. The
increase in same-store sales accounted for $204.0 million
of the increase in sales while stores opened since the
beginning of 2003 were the primary contributors to the
remaining $585.0 million sales increase during 2004.The
Company’s sales increase in 2004 was primarily attributa-
ble to the highly consumable category, which increased by
$618.2 million, or 14.7%.
Gross Profit. The gross profit rate declined by 82 basis
points in 2005 as compared with 2004 due to a number of
factors, including but not limited to: lower sales (as a per-
centage of total sales) in the Company’s seasonal, home
products and basic clothing categories, which have higher
than average markups; an increase in markdowns as a
percentage of sales primarily as a result of the Company’s
initiative to reduce per-store inventory; higher transporta-
tion expenses primarily attributable to increased fuel
costs; an increase in the Company’s shrink rate; and an
estimated $5.2 million reduction resulting from the
expansion of the number of departments utilized for the
gross profit calculation from 10 to 23, as further described
below under “Critical Accounting Policies and Estimates.”
These factors were partially offset by higher average
mark-ups on the Company’s beginning inventory in
2005 as compared with 2004. In 2005 and 2004, the
Company experienced inventory shrinkage of 3.22%
and 3.05%, respectively.
The gross profit rate increased 17 basis points in 2004
as compared with 2003. Although the Company’s gross
profit rate was pressured by sales mix shifts to more highly
consumable items, which typically carry lower gross profit
rates, the Company was able to more than offset this
through increases in gross markups on all merchandise
categories in 2004. More specific factors include higher
initial mark-ups on merchandise received during 2004 as
compared with 2003, achieved primarily from the positive
impact of opportunistic purchasing, renegotiating product
costs with several key suppliers, selective price increases,
and an increase in various performance-based vendor
rebates; and higher average mark-ups on the Company’s
beginning inventory in 2004 as compared to 2003, which
represents the cumulative impact of higher margin pur-
chases over time. These components of gross profit, which
positively impacted the Company’s results, were partially
offset by an increase in transportation expenses as a per-
centage of sales, resulting primarily from higher fuel costs