Dell 2011 Annual Report Download - page 79
Download and view the complete annual report
Please find page 79 of the 2011 Dell annual report below. You can navigate through the pages in the report by either clicking on the pages listed below, or by using the keyword search tool below to find specific information within the annual report.-
 1
1 -
2
-
3
-
4
-
5
-
6
-
7
-
8
-
9
-
10
-
11
-
12
-
13
-
14
-
15
-
16
-
17
-
18
-
19
-
20
-
21
-
22
-
23
-
24
-
25
-
26
-
27
-
28
-
29
-
30
-
31
-
32
-
33
-
34
-
35
-
36
-
37
-
38
-
39
-
40
-
41
-
42
-
43
-
44
-
45
-
46
-
47
-
48
-
49
-
50
-
51
-
52
-
53
-
54
-
55
-
56
-
57
-
58
-
59
-
60
-
61
-
62
-
63
-
64
-
65
-
66
-
67
-
68
-
 69
69 -
 70
70 -
 71
71 -
 72
72 -
 73
73 -
 74
74 -
 75
75 -
 76
76 -
 77
77 -
 78
78 -
 79
79 -
 80
80 -
 81
81 -
 82
82 -
 83
83 -
 84
84 -
 85
85 -
 86
86 -
 87
87 -
 88
88 -
 89
89 -
90
-
91
-
92
-
93
-
94
-
95
-
96
-
97
-
98
-
99
-
100
-
101
-
102
-
103
-
104
-
105
-
106
-
107
-
108
-
109
-
110
-
111
-
112
-
113
-
114
-
115
-
116
-
117
-
118
-
119
-
120
-
121
-
122
-
123
-
124
-
125
-
126
-
127
-
128
-
129
-
130
-
131
-
132
-
133
-
134
-
135
-
136
-
137
 |
 |

Table of Contents DELL INC.
NOTES TO CONSOLIDATED FINANCIAL STATEMENTS (Continued)
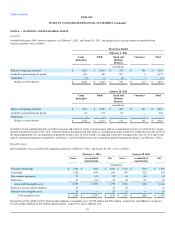
Credit Quality
The following tables summarize customer receivables, gross, including accrued interest by credit quality indicator segregated by class, as of February 3,
2012 , and January 28, 2011 . For revolving loans to consumers, Dell makes credit decisions based on propriety scorecards, which include the customer's
credit history, payment history, credit usage, and other credit agency-related elements. For Commercial customers, an internal grading system is utilized that
assigns a credit level score based on a number of considerations, including liquidity, operating performance, and industry outlook. These credit level scores
range from one to sixteen for Public and Large Enterprise customers, and generally from one to six for SMB customers. The categories shown in the tables
below segregate customer receivables based on the relative degrees of credit risk within each segment and product group. As loss experience varies
substantially between financial products and customer segments, the credit quality categories cannot be compared between the different classes. The credit
quality indicators for Consumer revolving accounts are primarily as of each quarter-end date, and all others are generally updated on a periodic basis.
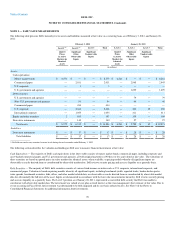
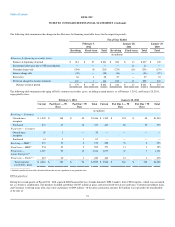
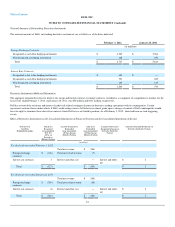
For the Consumer receivables shown in the below table, the higher quality category includes prime accounts which are generally of a higher credit quality that
are comparable to U.S. customer FICO scores of 720+. The mid-category represents the mid-tier accounts that are comparable to U.S. FICO scores from 660
to 719. The lower category is generally sub-prime and represents lower credit quality accounts that are comparable to FICO scores below 660.
February 3, 2012 January 28, 2011
Higher Mid Lower Total Higher Mid Lower Total
(in millions)
Revolving — Consumer
Owned since inception $ 220 $ 412 $ 814 $ 1,446 $ 251 $ 415 $ 837 $ 1,503
Purchased $ 28 $ 80 $ 229 $ 337 $ 50 $ 127 $ 393 $ 570
Fixed-term — Consumer
Owned since inception $ 2 $ 14 $ 14 $ 30 $ — $ — $ — $ —
Purchased $ 4 $ 32 $ 31 $ 67 $ — $ — $ — $ —
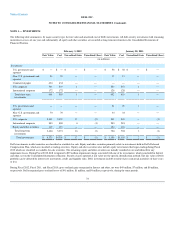
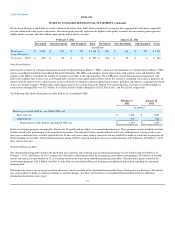
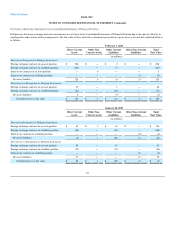
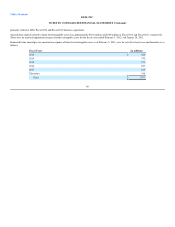
For the SMB receivables shown in the table below, the higher quality category includes receivables that are generally within Dell's top two internal credit
quality levels, which typically have the lowest loss experience. The middle category generally falls within credit levels three and four, and the lower category
generally falls within Dell's bottom two credit levels, which experience higher loss rates. The revolving product is sold primarily to small business customers
and the fixed-term products are more weighted toward medium-sized businesses. Although both fixed-term and revolving products generally rely on a six-
level internal rating system, the grading criteria and classifications are different as the loss performance varies between these product and customer sets.
Therefore, the credit levels are not comparable between the SMB fixed-term and revolving classes.
February 3, 2012 January 28, 2011(a)
Higher Mid Lower Total Higher Mid Lower Total
(in millions)
Revolving — SMB $ 111 $ 98 $ 104 $ 313 $ 124 $ 109 $ 90 $ 323
Fixed-term — SMB $ 43 $ 208 $ 311 $ 562 $ 55 $ 122 $ 208 $ 385
____________________
(a) Amounts as of January 28, 2011 have been reclassified for Fixed-term — SMB due to adjustments between credit quality categories.
76