Dell 2011 Annual Report Download - page 43
Download and view the complete annual report
Please find page 43 of the 2011 Dell annual report below. You can navigate through the pages in the report by either clicking on the pages listed below, or by using the keyword search tool below to find specific information within the annual report.-
 1
1 -
2
-
3
-
4
-
5
-
6
-
7
-
8
-
9
-
10
-
11
-
12
-
13
-
14
-
15
-
16
-
17
-
18
-
19
-
20
-
21
-
22
-
23
-
24
-
25
-
26
-
27
-
28
-
29
-
30
-
31
-
32
-
 33
33 -
 34
34 -
 35
35 -
 36
36 -
 37
37 -
 38
38 -
 39
39 -
 40
40 -
 41
41 -
 42
42 -
 43
43 -
 44
44 -
 45
45 -
 46
46 -
 47
47 -
 48
48 -
 49
49 -
 50
50 -
 51
51 -
 52
52 -
 53
53 -
54
-
55
-
56
-
57
-
58
-
59
-
60
-
61
-
62
-
63
-
64
-
65
-
66
-
67
-
68
-
69
-
70
-
71
-
72
-
73
-
74
-
75
-
76
-
77
-
78
-
79
-
80
-
81
-
82
-
83
-
84
-
85
-
86
-
87
-
88
-
89
-
90
-
91
-
92
-
93
-
94
-
95
-
96
-
97
-
98
-
99
-
100
-
101
-
102
-
103
-
104
-
105
-
106
-
107
-
108
-
109
-
110
-
111
-
112
-
113
-
114
-
115
-
116
-
117
-
118
-
119
-
120
-
121
-
122
-
123
-
124
-
125
-
126
-
127
-
128
-
129
-
130
-
131
-
132
-
133
-
134
-
135
-
136
-
137
 |
 |

Table of Contents
Revenue by Product and Services Categories
We design, develop, manufacture, market, sell, and support a wide range of products that in many cases are customized to individual customer requirements.
Our products are organized between enterprise and client categories. Our enterprise products include servers and networking, and storage products. Client
products include mobility and desktop PC products. Our services include a broad range of configurable IT and business services, including infrastructure
technology, consulting and applications, and product-related support services. We also offer software and peripheral products.
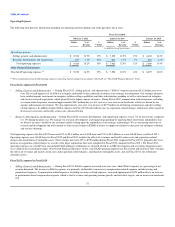
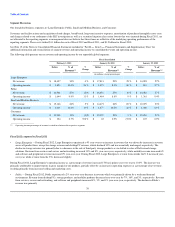
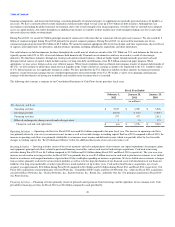
The following table summarizes our net revenue by product and services categories for each of the past three fiscal years:
Fiscal Year Ended
February 3, 2012 January 28, 2011 January 29, 2010
Dollars % of
Revenue %
Change Dollars % of
Revenue %
Change Dollars % of
Revenue
(in millions, except percentages)
Net revenue:
Enterprise solutions and services:
Enterprise solutions:
Servers and networking $ 8,336 13% 10 % $ 7,609 12% 26% $ 6,032 11%
Storage 1,943 3% (15)% 2,295 4% 5% 2,192 4%
Services 8,322 13% 8 % 7,673 12% 36% 5,622 11%
Software and peripherals 10,222 17% — % 10,261 17% 8% 9,499 18%
Client:
Mobility 19,104 31% 1 % 18,971 31% 14% 16,610 31%
Desktop PCs 14,144 23% (4)% 14,685 24% 13% 12,947 25%
Total net revenue $ 62,071 100% 1 % $ 61,494 100% 16% $ 52,902 100%
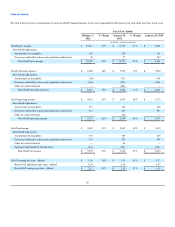
Fiscal 2012 compared to Fiscal 2011
•Enterprise Solutions and Services
▪Enterprise Solutions:
•Servers and Networking — The increase in our servers and networking revenue for Fiscal 2012 as compared to Fiscal 2011 was
primarily driven by increases in revenue from our PowerEdge lines of servers as well as our virtualized servers and data center
solutions. During Fiscal 2012, we saw an overall increase in demand and selling prices. We are continuing to shift towards more
differentiated products and solutions that command higher selling prices.
•Storage — During Fiscal 2012, storage revenue decreased 15%. The decrease in storage revenue was primarily attributable to an
anticipated decline in sales of third-party storage products, which was partially offset by revenue from sales of Dell-owned storage
products, such as our recently added Compellent products. During Fiscal 2012, sales of Dell-owned storage products increased 21%
to 82% of our total storage revenue compared to 57% in the prior year. We believe Dell-owned storage offerings, which can be sold
with service solutions will generate higher margins in the long-term. Our acquisition of Compellent during the first quarter of Fiscal
2012 has expanded our enterprise and data center storage offerings.
▪Services — During Fiscal 2012, services revenue increased 8% to $8.3 billion. The increase was driven by an increase in transactional revenue
as well as increases in outsourcing and project-based services revenue. The increase in outsourcing and project-based revenue was partially
driven by our recent acquisitions. Our estimated services backlog as of February 3, 2012, and January 28, 2011, was $15.5 billion and $13.9
billion, respectively. We provide information regarding services backlog because we believe it provides useful trend information regarding
changes in the size of our services business over time. Services backlog, as defined by us, includes deferred revenue from extended warranties
and contracted services backlog. Deferred revenue from extended warranties was $7.0 billion and $6.4 billion as of February 3, 2012, and
January 28, 2011, respectively. Estimated contracted services backlog, which is primarily related to our outsourcing services business, was
$8.5 billion and
41