Dell 2011 Annual Report Download - page 75
Download and view the complete annual report
Please find page 75 of the 2011 Dell annual report below. You can navigate through the pages in the report by either clicking on the pages listed below, or by using the keyword search tool below to find specific information within the annual report.-
 1
1 -
2
-
3
-
4
-
5
-
6
-
7
-
8
-
9
-
10
-
11
-
12
-
13
-
14
-
15
-
16
-
17
-
18
-
19
-
20
-
21
-
22
-
23
-
24
-
25
-
26
-
27
-
28
-
29
-
30
-
31
-
32
-
33
-
34
-
35
-
36
-
37
-
38
-
39
-
40
-
41
-
42
-
43
-
44
-
45
-
46
-
47
-
48
-
49
-
50
-
51
-
52
-
53
-
54
-
55
-
56
-
57
-
58
-
59
-
60
-
61
-
62
-
63
-
64
-
 65
65 -
 66
66 -
 67
67 -
 68
68 -
 69
69 -
 70
70 -
 71
71 -
 72
72 -
 73
73 -
 74
74 -
 75
75 -
 76
76 -
 77
77 -
 78
78 -
 79
79 -
 80
80 -
 81
81 -
 82
82 -
 83
83 -
 84
84 -
 85
85 -
86
-
87
-
88
-
89
-
90
-
91
-
92
-
93
-
94
-
95
-
96
-
97
-
98
-
99
-
100
-
101
-
102
-
103
-
104
-
105
-
106
-
107
-
108
-
109
-
110
-
111
-
112
-
113
-
114
-
115
-
116
-
117
-
118
-
119
-
120
-
121
-
122
-
123
-
124
-
125
-
126
-
127
-
128
-
129
-
130
-
131
-
132
-
133
-
134
-
135
-
136
-
137
 |
 |
Table of Contents DELL INC.
NOTES TO CONSOLIDATED FINANCIAL STATEMENTS (Continued)
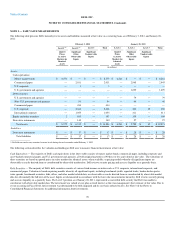
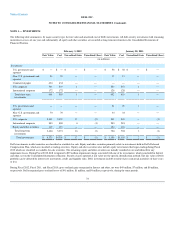
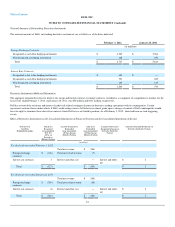
NOTE 3 — INVESTMENTS
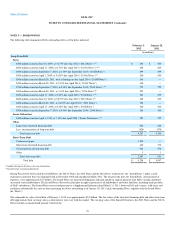
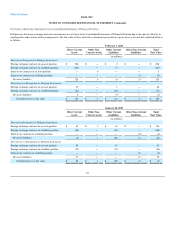
The following table summarizes, by major security type, the fair value and amortized cost of Dell's investments. All debt security investments with remaining
maturities in excess of one year and substantially all equity and other securities are recorded as long-term investments in the Consolidated Statements of
Financial Position.
February 3, 2012 January 28, 2011
Fair Value Cost Unrealized Gain Unrealized (Loss) Fair Value Cost Unrealized Gain Unrealized (Loss)
(in millions)
Investments:
U.S. government and
agencies
$ — $ — $ — $ — $ 58 $ 58 $ — $ —
Non- U.S. government and
agencies
24 24 — — 12 12 — —
Commercial paper 434 434 — — — — — —
U.S. corporate 336 335 1 — 254 253 1 —
International corporate 172 172 — — 128 128 — —
Total short-term
investments
966 965 1 — 452 451 1 —
U.S. government and
agencies
— — — — 21 20 1 —
Non- U.S. government and
agencies
70 70 — — 34 34 — —
U.S. corporate 2,332 2,322 12 (2) 242 243 — (1)
International corporate 883 880 4 (1) 283 283 — —
Equity and other securities 119 119 — — 124 124 — —
Total long-term
investments
3,404 3,391 16 (3) 704 704 1 (1)
Total investments $ 4,370 $4,356 $ 17 $ (3) $ 1,156 $1,155 $ 2 $ (1)
Dell's investments in debt securities are classified as available-for-sale. Equity and other securities primarily relate to investments held in Dell's Deferred
Compensation Plan, which are classified as trading securities. Equity and other securities also include equity investments that began trading during Fiscal
2012 which are classified as available-for-sale securities. The remaining equity and other securities are initially recorded at cost and reduced for any
impairment losses. During Fiscal 2012, Dell recognized a $39 million impairment charge associated with one of its investments, which is included in Interest
and other, net on the Consolidated Statements of Income. Security classes reported at fair value use the specific identification method. The fair value of Dell's
portfolio can be affected by interest rate movements, credit, and liquidity risks. Dell's investments in debt securities have contractual maturities of three years
or less.
During Fiscal 2012, Fiscal 2011, and Fiscal 2010, gross realized gains recognized in Interest and other, net were $49 million, $7 million, and $6 million,
respectively. Dell recognized gross realized losses of $41 million, $1 million, and $4 million, respectively, during the same periods.
72