Dell 2011 Annual Report Download - page 26
Download and view the complete annual report
Please find page 26 of the 2011 Dell annual report below. You can navigate through the pages in the report by either clicking on the pages listed below, or by using the keyword search tool below to find specific information within the annual report.-
 1
1 -
2
-
3
-
4
-
5
-
6
-
7
-
8
-
9
-
10
-
11
-
12
-
13
-
14
-
15
-
 16
16 -
 17
17 -
 18
18 -
 19
19 -
 20
20 -
 21
21 -
 22
22 -
 23
23 -
 24
24 -
 25
25 -
 26
26 -
 27
27 -
 28
28 -
 29
29 -
 30
30 -
 31
31 -
 32
32 -
 33
33 -
 34
34 -
 35
35 -
 36
36 -
37
-
38
-
39
-
40
-
41
-
42
-
43
-
44
-
45
-
46
-
47
-
48
-
49
-
50
-
51
-
52
-
53
-
54
-
55
-
56
-
57
-
58
-
59
-
60
-
61
-
62
-
63
-
64
-
65
-
66
-
67
-
68
-
69
-
70
-
71
-
72
-
73
-
74
-
75
-
76
-
77
-
78
-
79
-
80
-
81
-
82
-
83
-
84
-
85
-
86
-
87
-
88
-
89
-
90
-
91
-
92
-
93
-
94
-
95
-
96
-
97
-
98
-
99
-
100
-
101
-
102
-
103
-
104
-
105
-
106
-
107
-
108
-
109
-
110
-
111
-
112
-
113
-
114
-
115
-
116
-
117
-
118
-
119
-
120
-
121
-
122
-
123
-
124
-
125
-
126
-
127
-
128
-
129
-
130
-
131
-
132
-
133
-
134
-
135
-
136
-
137
 |
 |
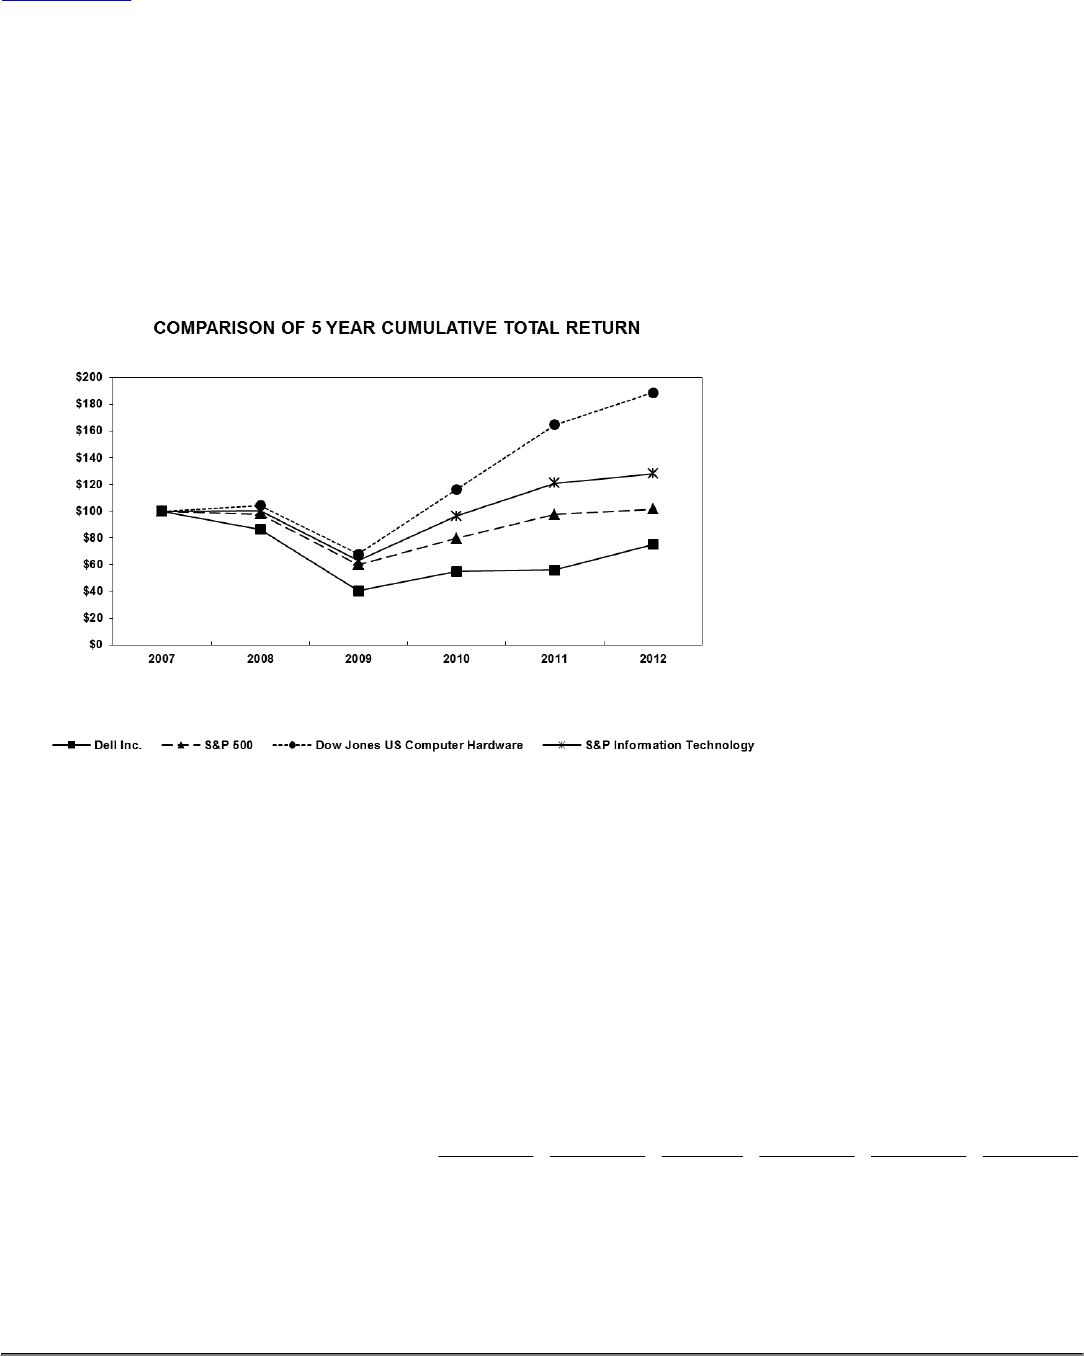
Table of Contents
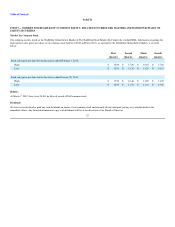
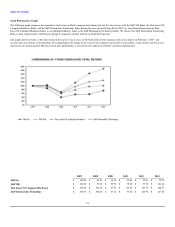
Stock Performance Graph
The following graph compares the cumulative total return on Dell's common stock during the last five fiscal years with the S&P 500 Index, the Dow Jones US
Computer Hardware Index, and the S&P Information Technology Index during the same period. During Fiscal 2012, we transitioned from using the Dow
Jones US Computer Hardware Index as our published industry index to the S&P Information Technology Index. We believe the S&P information Technology
Index is more representative of Dell's peer group of companies and the industry in which Dell operates.
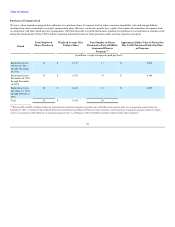
The graph shows the value, at the end of each of the last five fiscal years, of $100 invested in Dell common stock or the indices on February 2, 2007, and
assumes the reinvestment of all dividends. The graph depicts the change in the value of our common stock relative to the indices at the end of each fiscal year
and not for any interim period. Historical stock price performance is not necessarily indicative of future stock price performance.
2007 2008 2009 2010 2011 2012
Dell Inc. $ 100.00 $ 86.52 $ 40.39 $ 54.85 $ 55.91 $ 75.09
S&P 500 $ 100.00 $ 97.69 $ 59.95 $ 79.82 $ 97.53 $ 101.64
Dow Jones US Computer Hardware $ 100.00 $ 104.15 $ 67.90 $ 116.26 $ 164.70 $ 188.47
S&P Information Technology $ 100.00 $ 100.20 $ 63.12 $ 96.42 $ 120.92 $ 127.88
24