Dell 2011 Annual Report Download - page 108
Download and view the complete annual report
Please find page 108 of the 2011 Dell annual report below. You can navigate through the pages in the report by either clicking on the pages listed below, or by using the keyword search tool below to find specific information within the annual report.-
 1
1 -
2
-
3
-
4
-
5
-
6
-
7
-
8
-
9
-
10
-
11
-
12
-
13
-
14
-
15
-
16
-
17
-
18
-
19
-
20
-
21
-
22
-
23
-
24
-
25
-
26
-
27
-
28
-
29
-
30
-
31
-
32
-
33
-
34
-
35
-
36
-
37
-
38
-
39
-
40
-
41
-
42
-
43
-
44
-
45
-
46
-
47
-
48
-
49
-
50
-
51
-
52
-
53
-
54
-
55
-
56
-
57
-
58
-
59
-
60
-
61
-
62
-
63
-
64
-
65
-
66
-
67
-
68
-
69
-
70
-
71
-
72
-
73
-
74
-
75
-
76
-
77
-
78
-
79
-
80
-
81
-
82
-
83
-
84
-
85
-
86
-
87
-
88
-
89
-
90
-
91
-
92
-
93
-
94
-
95
-
96
-
97
-
 98
98 -
 99
99 -
 100
100 -
 101
101 -
 102
102 -
 103
103 -
 104
104 -
 105
105 -
 106
106 -
 107
107 -
 108
108 -
 109
109 -
 110
110 -
 111
111 -
 112
112 -
 113
113 -
 114
114 -
 115
115 -
 116
116 -
 117
117 -
 118
118 -
119
-
120
-
121
-
122
-
123
-
124
-
125
-
126
-
127
-
128
-
129
-
130
-
131
-
132
-
133
-
134
-
135
-
136
-
137
 |
 |

Table of Contents DELL INC.
NOTES TO CONSOLIDATED FINANCIAL STATEMENTS (Continued)
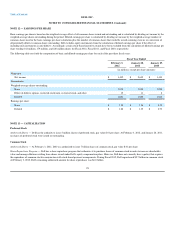
Supplemental Consolidated Statements of Financial Position Information (cont.)
February 3,
2012 January 28,
2011
(in millions)
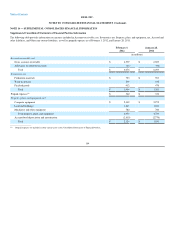
Accrued and other current liabilities:
Compensation $ 1,604 $ 1,550
Warranty liability 572 575
Income and other taxes 432 529
Other 1,326 1,527
Total $ 3,934 $ 4,181
Other non-current liabilities:
Warranty liability $ 316 $ 320
Unrecognized tax benefits, net 2,563 2,293
Deferred tax liabilities 405 —
Other 108 73
Total $ 3,392 $ 2,686
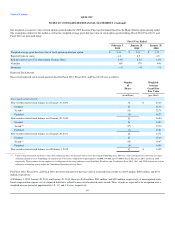
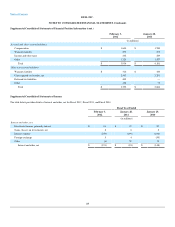
Supplemental Consolidated Statements of Income
The table below provides details of interest and other, net for Fiscal 2012, Fiscal 2011, and Fiscal 2010:
Fiscal Year Ended
February 3,
2012 January 28,
2011 January 29,
2010
(in millions)
Interest and other, net:
Investment income, primarily interest $ 81 $ 47 $ 57
Gains (losses) on investments, net 8 6 2
Interest expense (279) (199) (160)
Foreign exchange 5 4 (59)
Other (6) 59 12
Interest and other, net $ (191) $ (83) $ (148)
105