Dell 2011 Annual Report Download - page 41
Download and view the complete annual report
Please find page 41 of the 2011 Dell annual report below. You can navigate through the pages in the report by either clicking on the pages listed below, or by using the keyword search tool below to find specific information within the annual report.-
 1
1 -
2
-
3
-
4
-
5
-
6
-
7
-
8
-
9
-
10
-
11
-
12
-
13
-
14
-
15
-
16
-
17
-
18
-
19
-
20
-
21
-
22
-
23
-
24
-
25
-
26
-
27
-
28
-
29
-
30
-
 31
31 -
 32
32 -
 33
33 -
 34
34 -
 35
35 -
 36
36 -
 37
37 -
 38
38 -
 39
39 -
 40
40 -
 41
41 -
 42
42 -
 43
43 -
 44
44 -
 45
45 -
 46
46 -
 47
47 -
 48
48 -
 49
49 -
 50
50 -
 51
51 -
52
-
53
-
54
-
55
-
56
-
57
-
58
-
59
-
60
-
61
-
62
-
63
-
64
-
65
-
66
-
67
-
68
-
69
-
70
-
71
-
72
-
73
-
74
-
75
-
76
-
77
-
78
-
79
-
80
-
81
-
82
-
83
-
84
-
85
-
86
-
87
-
88
-
89
-
90
-
91
-
92
-
93
-
94
-
95
-
96
-
97
-
98
-
99
-
100
-
101
-
102
-
103
-
104
-
105
-
106
-
107
-
108
-
109
-
110
-
111
-
112
-
113
-
114
-
115
-
116
-
117
-
118
-
119
-
120
-
121
-
122
-
123
-
124
-
125
-
126
-
127
-
128
-
129
-
130
-
131
-
132
-
133
-
134
-
135
-
136
-
137
 |
 |

Table of Contents
attributable to revenue decreases in the U.S. and Western Europe, largely because of budgetary constraints on public spending, the effects of which were
partially offset by revenue growth in APJ.
During Fiscal 2012, Public's operating income as a percentage of net revenue increased 110 basis points to 9.9%. The increase was primarily attributable to
improvements in gross margin for our products, partially offset by an increase in operating expenses as a percentage of net revenue, which was primarily due
to increased selling and marketing costs.
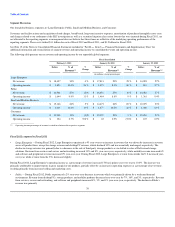
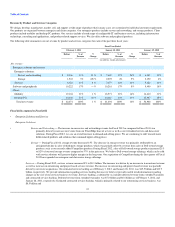
•Small and Medium Business — During Fiscal 2012, SMB experienced a 5% year-over-year increase in revenue that was primarily attributable to
increases from enterprise solutions and services and software and peripherals, partially offset by a slight decrease in mobility revenue. Revenue from
servers and networking, storage, and services increased 17%, 10%, and 21%, year-over-year, respectively. Revenue from software and peripherals and
desktop PCs increased 5% and 1%, year-over-year, respectively, while mobility product revenue declined 2% year-over-year. SMB experienced revenue
growth across all regions.
During Fiscal 2012, SMB's operating income as a percentage of net revenue increased 80 basis points to 11.0%. The increase was primarily attributable to
improvements in gross margin for our products, partially offset by an increase in operating expenses as a percentage of net revenue, resulting principally from
increased selling and marketing costs.
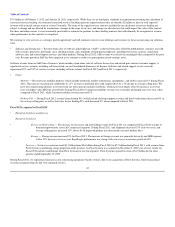
•Consumer — During Fiscal 2012, Consumer experienced a 4% year-over-year decrease in revenue. Revenue from all product and services categories
decreased during Fiscal 2012, except mobility product revenue, which increased slightly. The overall decrease in consumer revenue was driven by a 12%
decline in revenue from desktop PCs and a 16% decline in revenue from software and peripherals. During Fiscal 2012, desktop PC unit sales declined
4% and the average selling price of desktop PCs decreased 8%. The decline in software and peripherals revenue was due to the removal of lower-margin
products from our portfolio of software and peripheral product offerings. Mobility revenue increased 1% due to an increase in units sold of 6%, which
was largely driven by an overall increase in demand for our higher-value product lines. The revenue increase from the increase in units sold was largely
offset by a decrease in average selling prices of 4%. Revenue from Consumer services decreased 7%, year-over-year, largely due to decreased sales from
our U.S. business as well as lower attach rates on our product sales. Revenue from the U.S. decreased 18% year-over-year, while revenue from outside
of the U.S. increased 10%. Revenue from Growth Countries increased 27% over the prior year.
For Fiscal 2012, Consumer's operating income percentage as a percentage of net revenue increased 220 basis points, year-over-year, to 2.7%. The increase in
operating income percentage was largely attributable to an increase in our product gross margin percentage due to a more favorable component cost
environment. In addition, during Fiscal 2012, we sold more units of higher-value client products, as compared to the prior year. Furthermore, we have
experienced year-over-year increases in profitability from our customer financing arrangements, which benefited from improvements in consumer credit loss
performance on our owned and purchased portfolios. We believe the impact of this improved profitability from our financing arrangements will moderate in
future periods as our loss rates have stabilized and as our overall consumer financing portfolio is declining. The positive effects of these factors have been
partially offset by a slight increase in operating expenses as a percentage of revenue year-over-year due to increased selling and marketing costs.
Fiscal 2011 compared to Fiscal 2010
•Large Enterprise — The year-over-year increase in Large Enterprise's revenue for Fiscal 2011 was mainly attributable to improved demand due to a
hardware refresh among our Large Enterprise customers. Large Enterprise experienced year-over-year increases in revenue across all product lines during
Fiscal 2011, except for storage revenue, which declined 5%. The decrease in storage revenue was primarily due to a decrease in the sale of third-party
storage products as we shifted more towards Dell-owned storage solutions. Revenue from servers and networking and services increased 33% and 35%,
respectively. The increase in services revenue was largely due to the acquisition of Perot Systems in Fiscal 2010. Sales of client products generated large
revenue increases, with mobility and desktop PCs revenue increasing 33% and 25%, year-over-year, respectively. During Fiscal 2011, Large Enterprise's
revenue increased year-over-year across all regions.
During Fiscal 2011, operating income as a percentage of revenue increased 260 basis points year-over-year to 8.3%. The increase was mostly driven by
improvements in gross margin due to a shift in gross margin mix to enterprise solutions and services, improved component costs, better product quality, and
improved pricing discipline, particularly in the latter half of Fiscal 2011 for client products. Revenue increases and tighter spending controls on operating
expenses resulted in a decrease in operating expenses as a percentage of net revenue.
•Public — During Fiscal 2011, Public experienced a year-over-year increase in revenue across all product and service categories. Services contributed the
largest increase, with a 69% increase in revenue over the prior year. The increase in
39