Dell 2011 Annual Report Download - page 105
Download and view the complete annual report
Please find page 105 of the 2011 Dell annual report below. You can navigate through the pages in the report by either clicking on the pages listed below, or by using the keyword search tool below to find specific information within the annual report.-
 1
1 -
2
-
3
-
4
-
5
-
6
-
7
-
8
-
9
-
10
-
11
-
12
-
13
-
14
-
15
-
16
-
17
-
18
-
19
-
20
-
21
-
22
-
23
-
24
-
25
-
26
-
27
-
28
-
29
-
30
-
31
-
32
-
33
-
34
-
35
-
36
-
37
-
38
-
39
-
40
-
41
-
42
-
43
-
44
-
45
-
46
-
47
-
48
-
49
-
50
-
51
-
52
-
53
-
54
-
55
-
56
-
57
-
58
-
59
-
60
-
61
-
62
-
63
-
64
-
65
-
66
-
67
-
68
-
69
-
70
-
71
-
72
-
73
-
74
-
75
-
76
-
77
-
78
-
79
-
80
-
81
-
82
-
83
-
84
-
85
-
86
-
87
-
88
-
89
-
90
-
91
-
92
-
93
-
94
-
 95
95 -
 96
96 -
 97
97 -
 98
98 -
 99
99 -
 100
100 -
 101
101 -
 102
102 -
 103
103 -
 104
104 -
 105
105 -
 106
106 -
 107
107 -
 108
108 -
 109
109 -
 110
110 -
 111
111 -
 112
112 -
 113
113 -
 114
114 -
 115
115 -
116
-
117
-
118
-
119
-
120
-
121
-
122
-
123
-
124
-
125
-
126
-
127
-
128
-
129
-
130
-
131
-
132
-
133
-
134
-
135
-
136
-
137
 |
 |

Table of Contents DELL INC.
NOTES TO CONSOLIDATED FINANCIAL STATEMENTS (Continued)
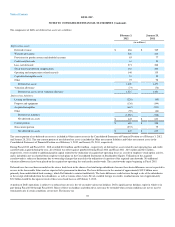
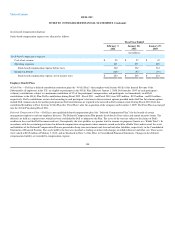
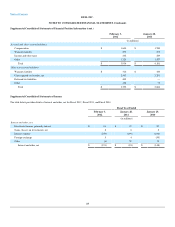
The following table presents assets by Dell's reportable global segments. Segment assets primarily consist of accounts receivable and inventories.
February 3,
2012 January 28,
2011
(in millions)
Total assets:
Corporate $ 36,171 $ 30,264
Large Enterprise 3,108 2,934
Public 2,330 2,545
Small and Medium Business 1,421 1,398
Consumer 1,503 1,458
Total $ 44,533 $ 38,599
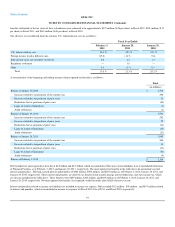
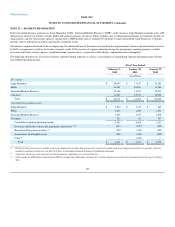
The following table presents depreciation expense by Dell's reportable business segments:
Fiscal Year Ended
February 3,
2012 January 28,
2011 January 29,
2010
(in millions)
Depreciation expense:
Large Enterprise $ 162 $ 180 $ 175
Public 145 170 177
Small and Medium Business 133 146 148
Consumer 105 125 147
Total $ 545 $ 621 $ 647
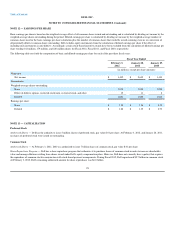
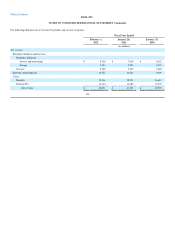
The following tables present net revenue and long-lived asset information allocated between the U.S. and foreign countries:
Fiscal Year Ended
February 3,
2012 January 28,
2011 January 29,
2010
(in millions)
Net revenue:
United States $ 30,404 $ 31,912 $ 28,053
Foreign countries 31,667 29,582 24,849
Total $ 62,071 $ 61,494 $ 52,902
February 3,
2012 January 28,
2011
(in millions)
Long-lived assets:
United States $ 1,577 $ 1,419
Foreign countries 547 534
Total $ 2,124 $ 1,953
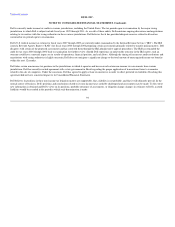
The allocation between domestic and foreign net revenue is based on the location of the customers. Net revenue and long-lived assets from any single foreign
country did not constitute more than 10% of Dell's consolidated net revenues or long-lived assets during Fiscal 2012, Fiscal 2011, or Fiscal 2010.
102