Dell 2011 Annual Report Download - page 77
Download and view the complete annual report
Please find page 77 of the 2011 Dell annual report below. You can navigate through the pages in the report by either clicking on the pages listed below, or by using the keyword search tool below to find specific information within the annual report.-
 1
1 -
2
-
3
-
4
-
5
-
6
-
7
-
8
-
9
-
10
-
11
-
12
-
13
-
14
-
15
-
16
-
17
-
18
-
19
-
20
-
21
-
22
-
23
-
24
-
25
-
26
-
27
-
28
-
29
-
30
-
31
-
32
-
33
-
34
-
35
-
36
-
37
-
38
-
39
-
40
-
41
-
42
-
43
-
44
-
45
-
46
-
47
-
48
-
49
-
50
-
51
-
52
-
53
-
54
-
55
-
56
-
57
-
58
-
59
-
60
-
61
-
62
-
63
-
64
-
65
-
66
-
 67
67 -
 68
68 -
 69
69 -
 70
70 -
 71
71 -
 72
72 -
 73
73 -
 74
74 -
 75
75 -
 76
76 -
 77
77 -
 78
78 -
 79
79 -
 80
80 -
 81
81 -
 82
82 -
 83
83 -
 84
84 -
 85
85 -
 86
86 -
 87
87 -
88
-
89
-
90
-
91
-
92
-
93
-
94
-
95
-
96
-
97
-
98
-
99
-
100
-
101
-
102
-
103
-
104
-
105
-
106
-
107
-
108
-
109
-
110
-
111
-
112
-
113
-
114
-
115
-
116
-
117
-
118
-
119
-
120
-
121
-
122
-
123
-
124
-
125
-
126
-
127
-
128
-
129
-
130
-
131
-
132
-
133
-
134
-
135
-
136
-
137
 |
 |
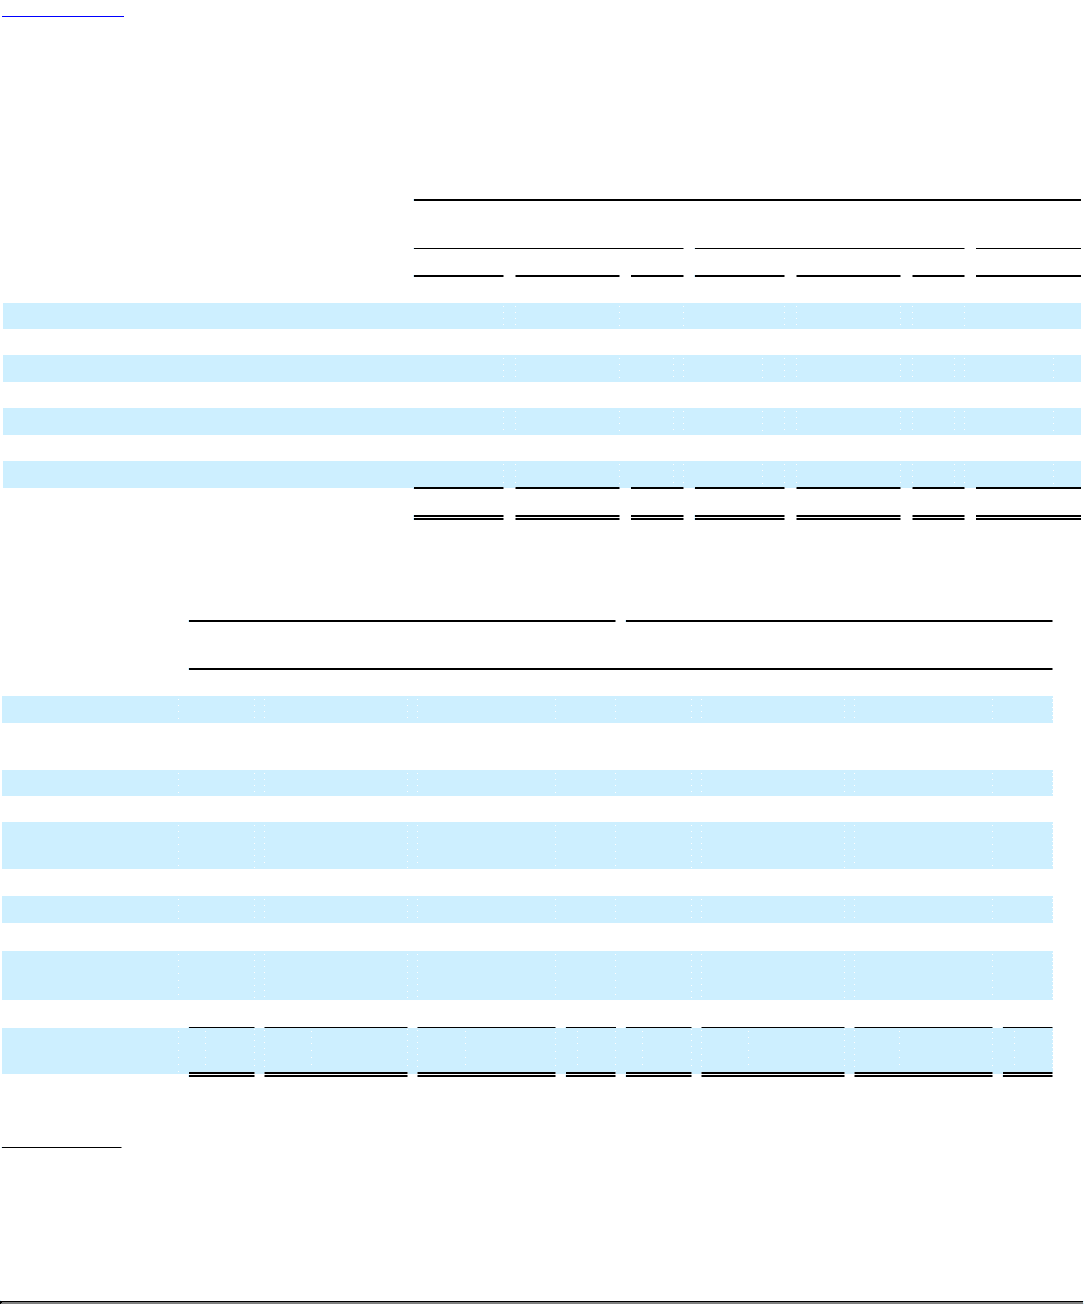
Table of Contents DELL INC.
NOTES TO CONSOLIDATED FINANCIAL STATEMENTS (Continued)
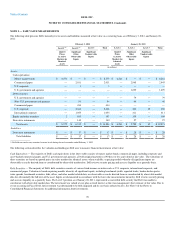
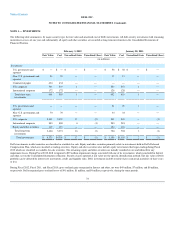
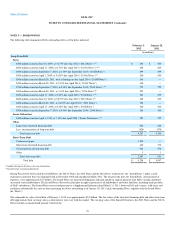
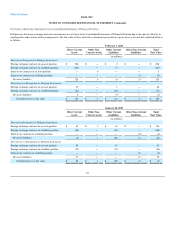
The following table summarizes the changes in the allowance for financing receivable losses for the respective periods:
Fiscal Year Ended
February 3,
2012 January 28,
2011 January 29,
2010
Revolving Fixed- term Total Revolving Fixed- term Total Total
(in millions)
Allowance for financing receivable losses:
Balance at beginning of period $ 214 $ 27 $ 241 $ 224 $ 13 $ 237 $ 149
Incremental allowance due to VIE consolidation — — — — 16 16 —
Principal charge-offs (204) (9) (213) (233) (18) (251) (139)
Interest charge-offs (38) — (38) (46) — (46) (27)
Recoveries 64 4 68 27 — 27 10
Provision charged to income statement 143 1 144 242 16 258 244
Balance at end of period $ 179 $ 23 $ 202 $ 214 $ 27 $ 241 $ 237
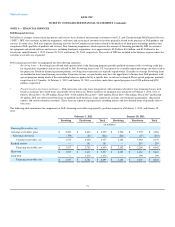
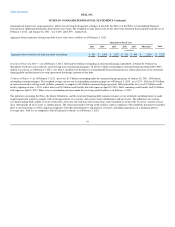
The following table summarizes the aging of Dell's customer receivables, gross, including accrued interest, as of February 3, 2012, and January 28, 2011,
segregated by class:
February 3, 2012 January 28, 2011
Current Past Due 1 — 90
Days Past Due > 90
Days Total Current Past Due 1 — 90
Days Past Due > 90
Days Total
(in millions)
Revolving — Consumer
Owned since
inception
$ 1,249 $ 148 $ 49 $1,446 $ 1,302 $ 153 $ 48 $1,503
Purchased 272 47 18 337 447 88 35 570
Fixed-term — Consumer
Owned since
inception
29 1 — 30 — — — —
Purchased 61 5 1 67 — — — —
Revolving — SMB(a) 272 33 8 313 280 35 8 323
Fixed-term — SMB(a) 534 23 5 562 371 11 3 385
Fixed-term —
Large Enterprise(a)
1,227 95 12 1,334 1,077 47 7 1,131
Fixed-term — Public(a) 419 30 1 450 463 12 1 476
Total customer
receivables, gross
$ 4,063 $ 382 $ 94 $4,539 $ 3,940 $ 346 $ 102 $4,388
____________________
(a) Includes purchased receivables described below that are not significant to any portfolio class.
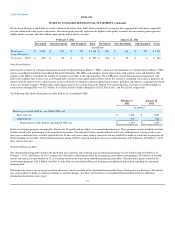
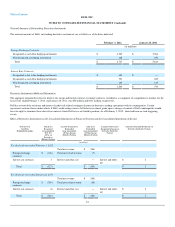
DFS Acquisitions
During the second quarter of Fiscal 2012 , Dell acquired Dell Financial Services Canada Limited ("DFS Canada") from CIT Group Inc., which was accounted
for as a business combination. The purchase included a portfolio of $367 million in gross contractual fixed-term leases and loans, Consumer installment loans,
and Consumer revolving loans with a fair value at purchase of $309 million . Of the gross contractual amounts, $23 million was expected to be uncollectible
at the date of
74